5. Multi-node and tunneling
In the previous parts we saw the basics thanks to a single node sandbox. In this part we will use a multi-nodes deployment and we will see how Skydive can analyze an encapsulated traffic. There are different handy ways to deploy a multi-node environment with Skydive, here we will use the `Vagrantfile` which comes with the Skydive repository.
One Vagrantfile, three nodes
First be sure that you have enough memory, the deployment requires a bit less than 5G of memory. As said in the introduction, the `Vagrantfile` comes with the sources of Skydive, so we just need to clone the project. Go to the `contrib` folder and start vagrant.
git clone https://github.com/skydive-project/skydive
cd skydive/contrib/vagrant
vagrant up
3 hosts were deployed : 1 analyzer and 2 agents. The analyzer WebUI is available at http://192.168.50.10:8082.
With the topology expanded, we will get something like this :
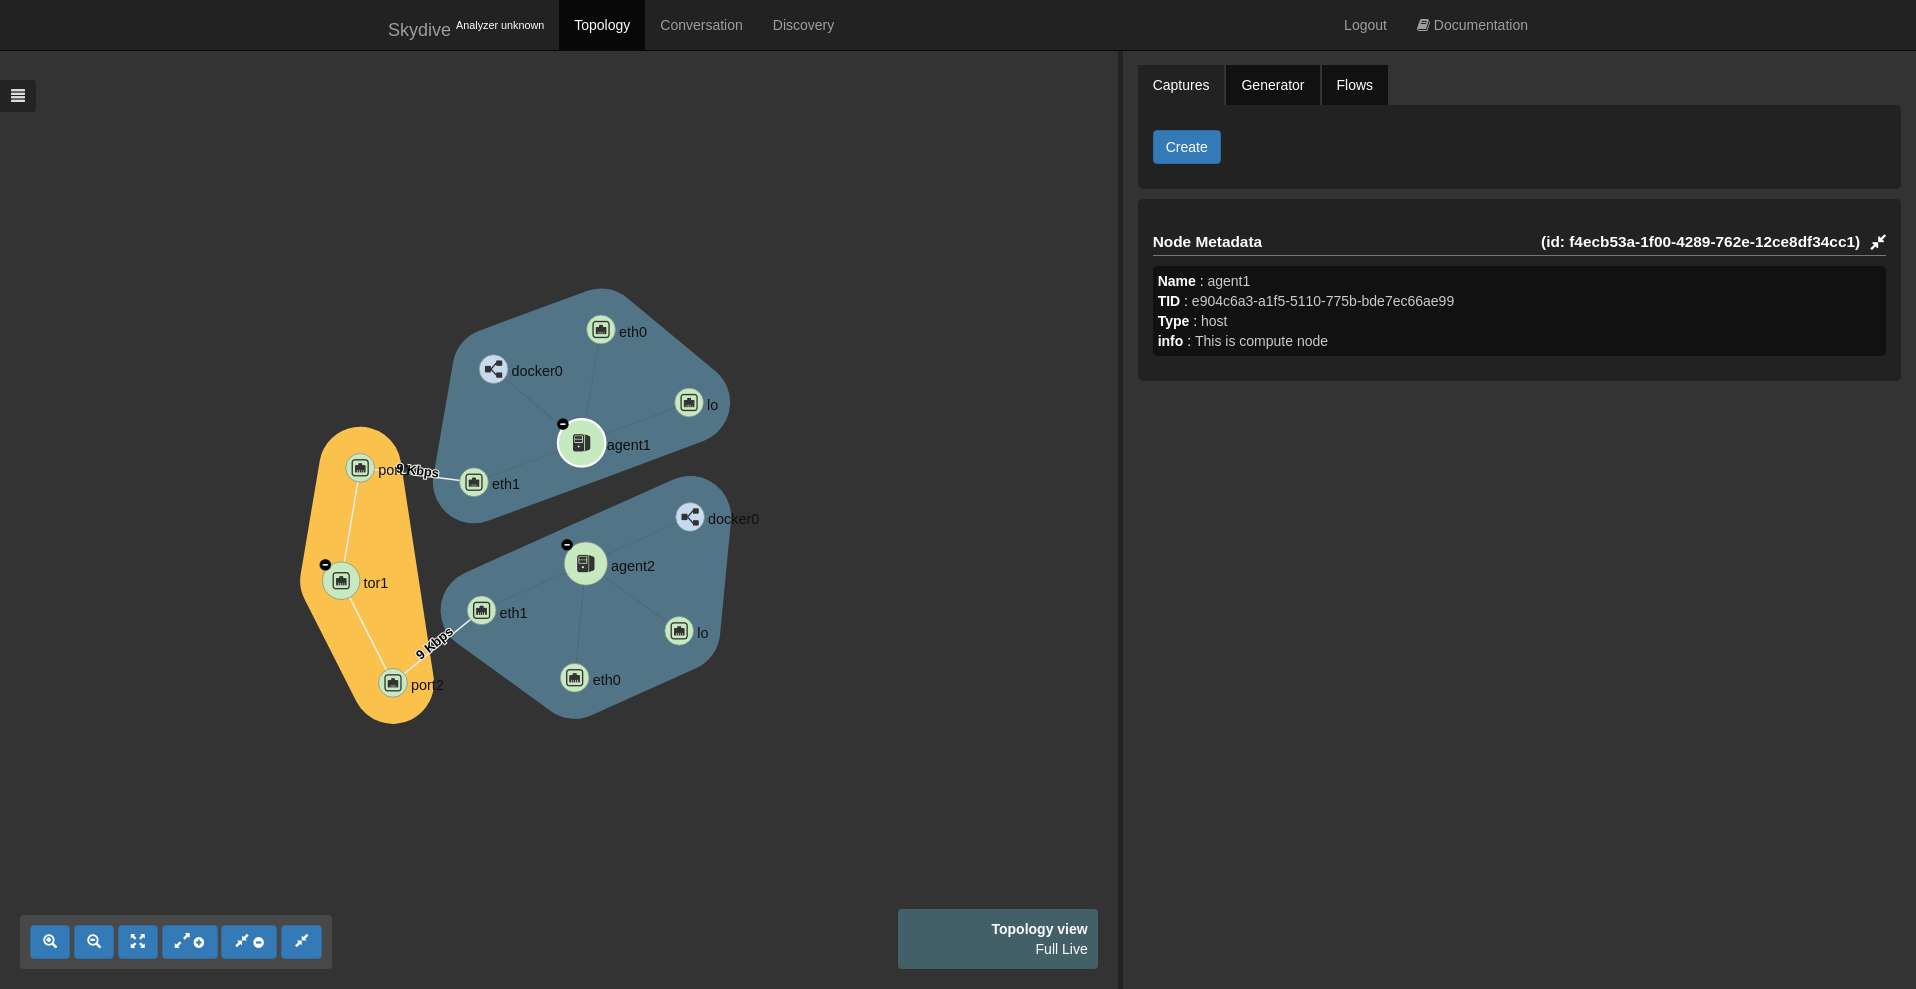
What the Vagrantfile did is simple. It deployed the Skydive binary on every host, using the default config file which can be found
here. The config is stored in
/etc/skydive/skydive.yml.
For the agents, only the analyzers list is set to specify the analyzer address.
analyzers:
- 192.168.50.10:8082
The analyzer configuration is a bit more complex. Elasticsearch is specified as backend for the flows :
analyzer:
  storage:
    backend: elasticsearch
and the topology :
graph:
  backend: elasticsearch
The way the agents are connected together is also described in the config file. We are not going to detail here the syntax but basically it creates a TOR1 node and two port nodes TOR1_PORT1, TOR1_PORT2 connected to the eth1 interface of the host agents.
analyzer:
  topology:
    fabric:
    - TOR1[Name=tor1] -> TOR1_PORT1[Name=port1, MTU=1500]
    - TOR1_PORT1 -> *[Type=host, Name=agent1]/eth1
    - TOR1[Name=tor1] -> TOR1_PORT2[Name=port2, MTU=1500]
    - TOR1_PORT2 -> *[Type=host, Name=agent2]/eth1
Packet journey within a tunnel
Now we have a properly working multi-node deployment, we can create a topology with tunnels. For that purpose we use Open vSwitch with GRE tunnels. The following command lines executed on the agent1 will create a network namespace connected to a bridge and will add a GRE interface :
vagrant ssh agent1

sudo ip netns add ns1
sudo ip link add ns1-eth0 type veth peer name eth0 netns ns1
sudo ip link set ns1-eth0 up
sudo ip netns exec ns1 ip link set eth0 up
sudo ip netns exec ns1 ip address add 10.0.0.1/24 dev eth0
sudo ovs-vsctl add-br br0
sudo ovs-vsctl add-port br0 ns1-eth0
sudo ovs-vsctl add-port br0 gre0 -- set interface gre0 type=gre options:remote_ip=192.168.50.30
Same thing on the second agent host with the following command lines :
vagrant ssh agent2
sudo ip netns add ns2
sudo ip link add ns2-eth0 type veth peer name eth0 netns ns2
sudo ip link set ns2-eth0 up
sudo ip netns exec ns2 ip link set eth0 up
sudo ip netns exec ns2 ip address add 10.0.0.2/24 dev eth0
sudo ovs-vsctl add-br br0
sudo ovs-vsctl add-port br0 ns2-eth0
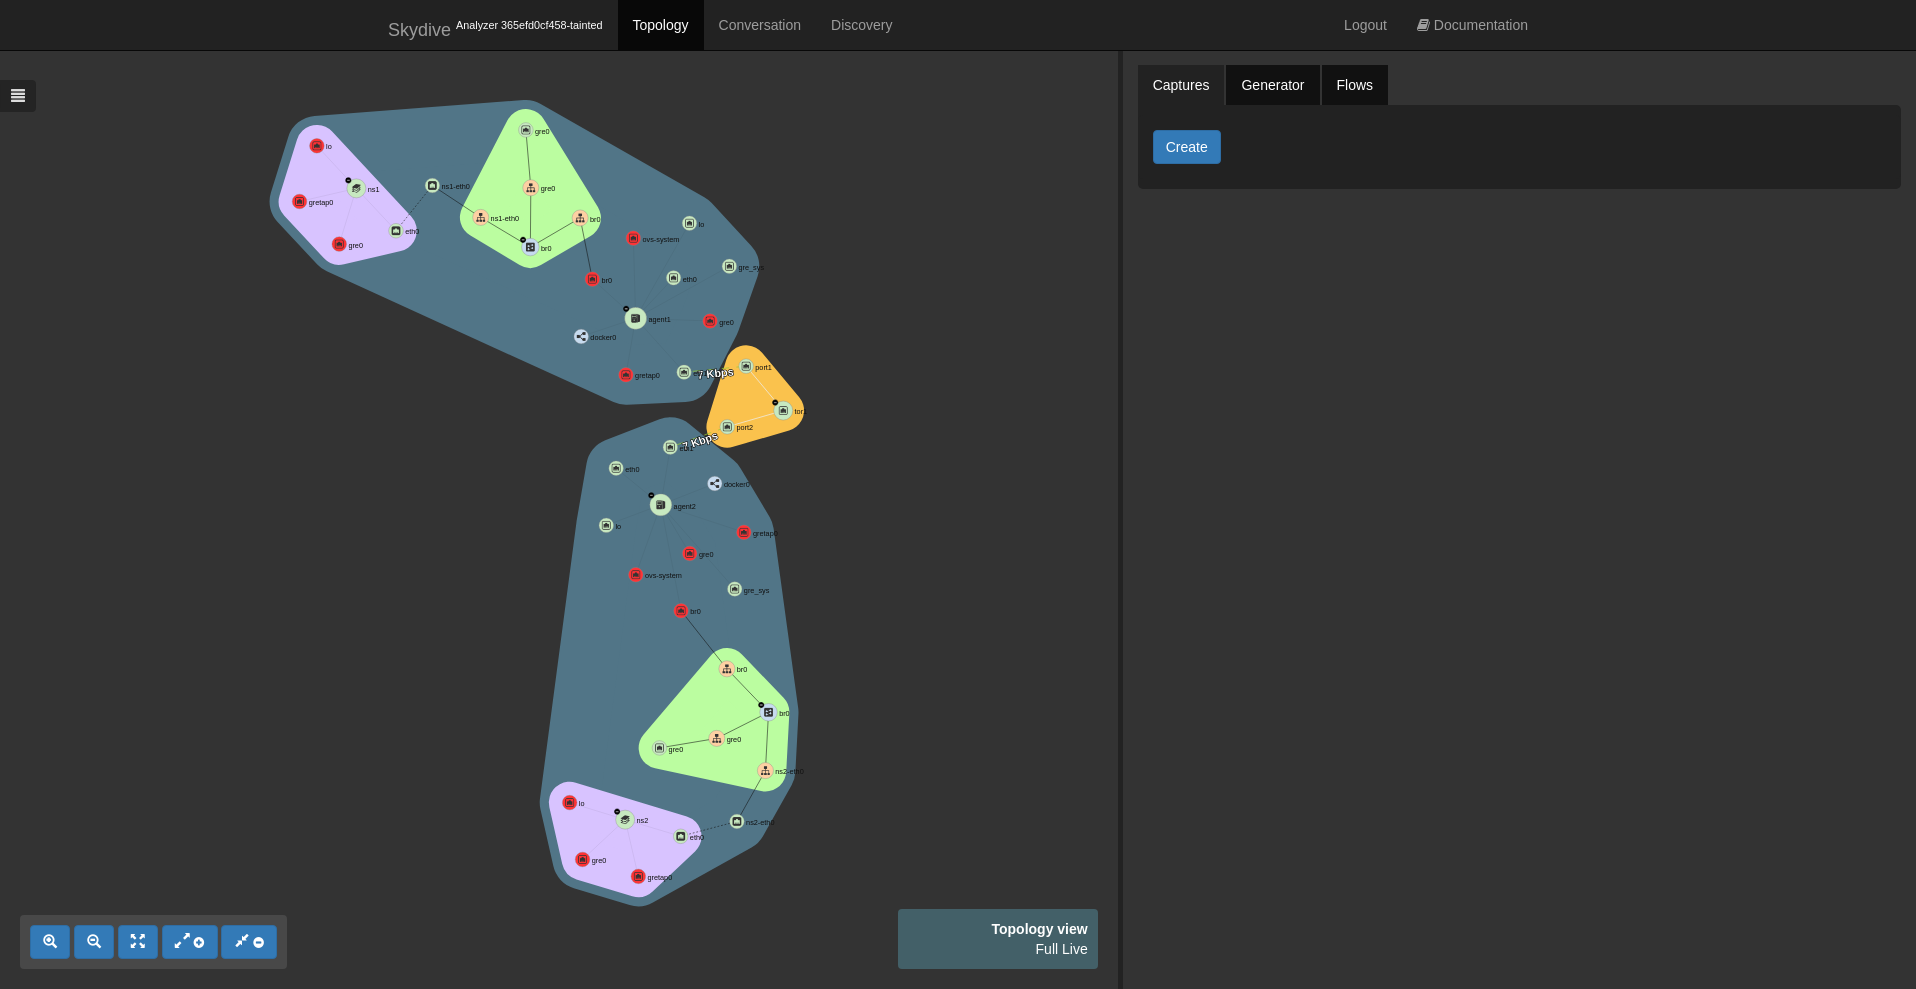
sudo ovs-vsctl add-port br0 gre0 -- set interface gre0 type=gre options:remote_ip=192.168.50.20Once executed, Skydive should have detected the two network namespaces with all the links and should look like this.
Now we can create 3 captures, one on a the eth1 interface of an agent host, and one other on each Open vSwitch bridge.
Once the captures are created, we can use the packet injector to generate pings between the two network namespaces.
By selecting the eth1 interface, we can check the flows and see that we have our ICMP packets and a GRE flow. We see that Skydive is analyzing inner packets and thanks to that we can confirm that a packet has been seen even within a tunnel. We can verify the relation between the inner packet and the outer packet by checking the field ParentUUID of the inner packet. This field references the UUID of the flow of the tunnel.
Skydive currently supports tunneling protocol like GRE, VXLAN, GENEVE, MPLS/GRE, MPLS/UDP and supports multiple levels of encapsulation.