What performance can I expect ?
by Sylvain Afchain, 07/02/2019In this article I’m going to try to answer to a question that often comes up about Skydive : “Ok but what will be the impact on my system”. Answering this question can be complex as Skydive address multiple use cases. So for this article I’ll take a very common use case which is monitoring the topology and the interfaces metrics. Here it won’t talk about packet capture, We will talk about this aspect in a further article.
A bit of background
Since the beginning we tried to keep Skydive as a lightweight solution. Almost all the aspect of the monitoring is event based. We use polling only when there is no other solution or when it makes sense to keep performance impacts low. Today only the interface metrics is using polling as there is not other solution and it makes sense to do sampling.
Let’s stress it
In order to build the test environment I used a sandbox script that we use to do scaling and profiling tests. It can generate a “virtual” environment with multiple analyzers, agents, and network namespaces. As for this test we want to monitor what is the impact on the Skydive agent, we will use one 1 analyzer, 1 agent and we will play with the number of network namespaces.
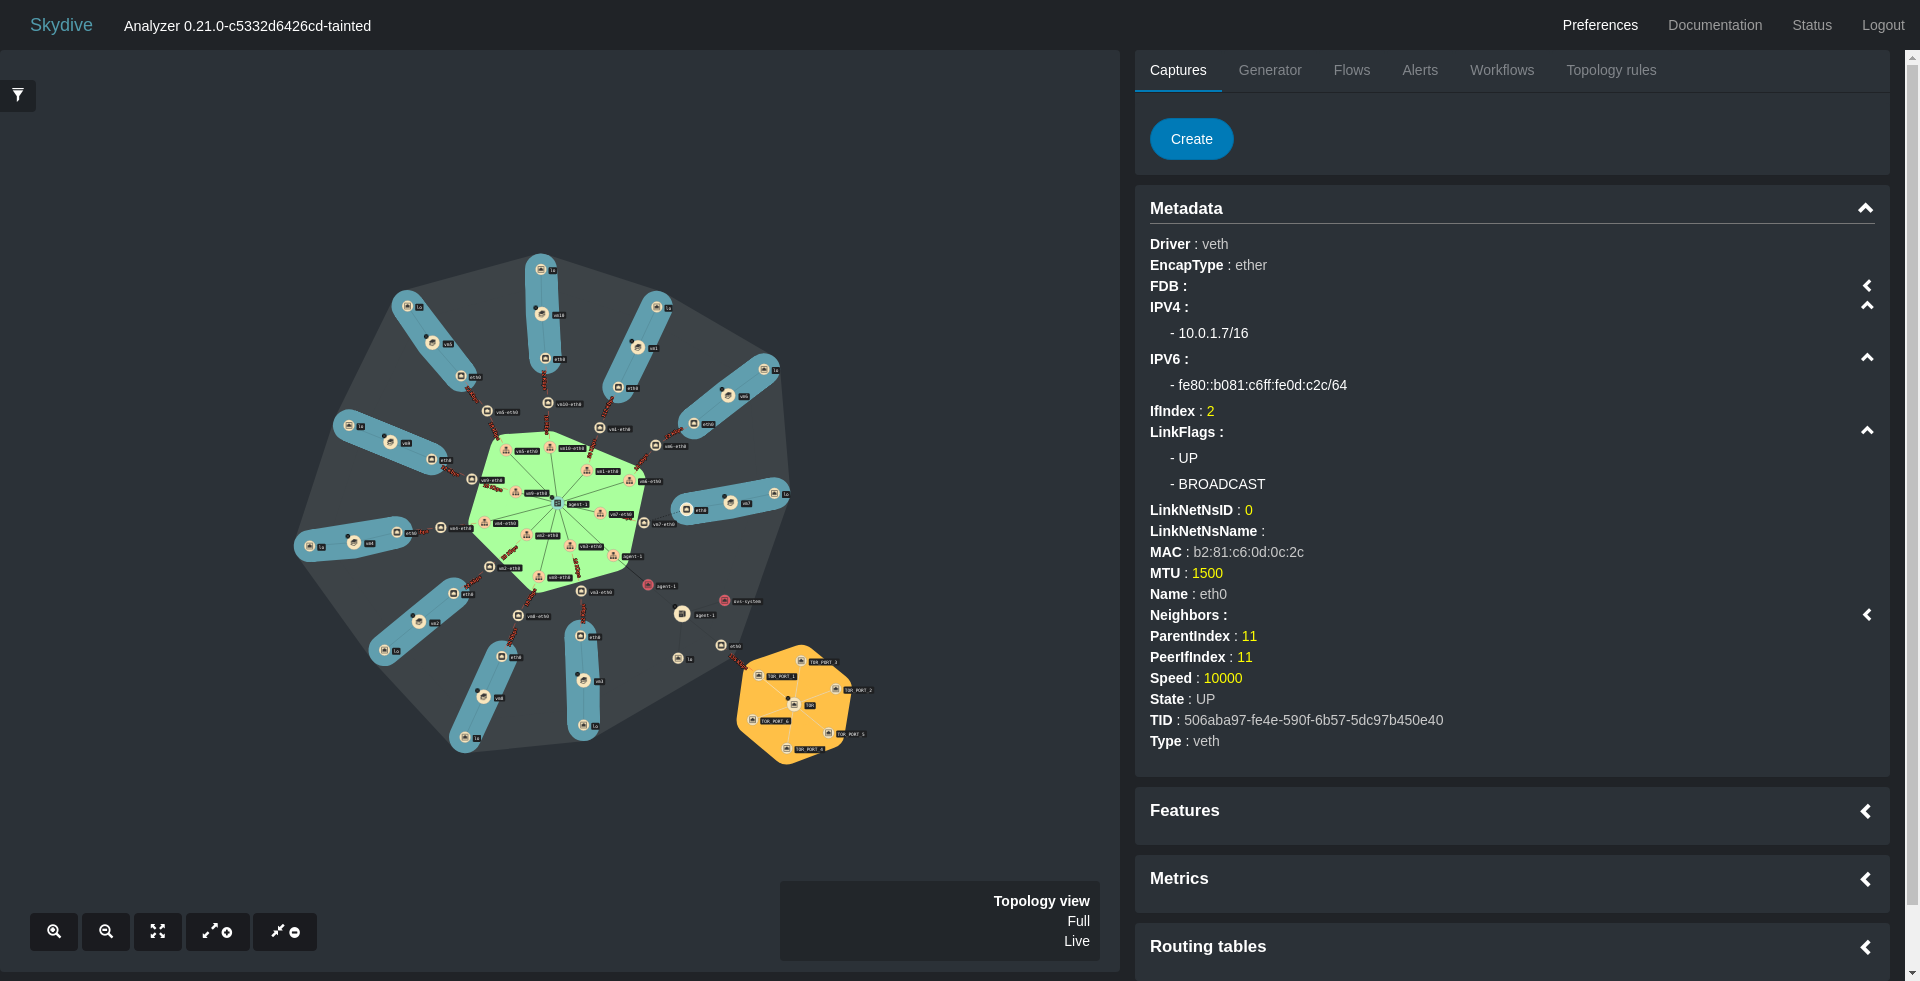
A such environment with 10 network namespaces gives the following topology. As you can see there is an OpenvSwitch bridge to connect all the namespaces.
I did the test on my laptop while writing these lines. As you will see there is no need to invest to a bigger setup. My laptop is made of 1 Intel i7-5600U and 8Go of RAM.
I used the default metric polling rate which is of 5 seconds.
Below the results of the tests with different density of network namespaces for a given host. As network namespaces are used by containers the results will be really closed to what we would get using Docker containers for example.
First view
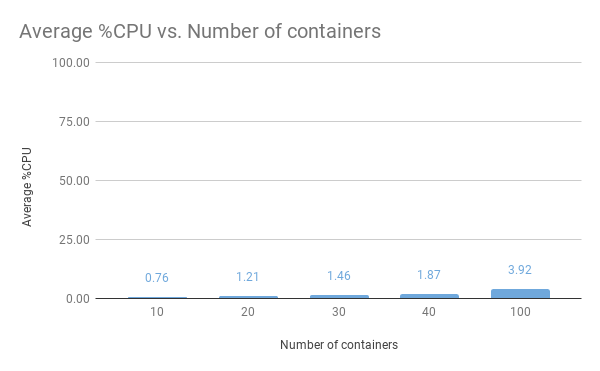
Let’s do it simple for now, just checking CPU usage per number of network namespace. It has been achieved by getting usage samples each 500ms.
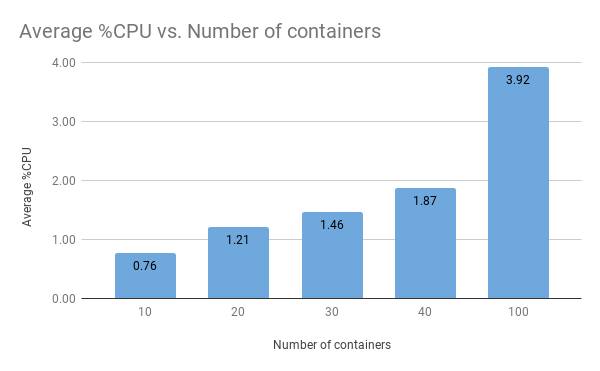
As we can see even with 100 network namespaces on a host the CPU usage of Skydive is low.
Let’s change the scale ratio to see a bit more details.
Now we may want to check during a period of time what is the CPU usage.
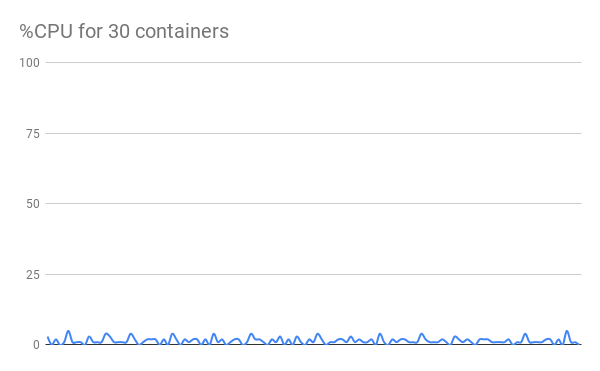
We see tiny peaks but what are they ? As we said Skydive interface metrics are samples and the polling rate can be configured via a configuration parameter. Since we didn’t set anything for this test we see peaks almost each 5 seconds which is the default value.
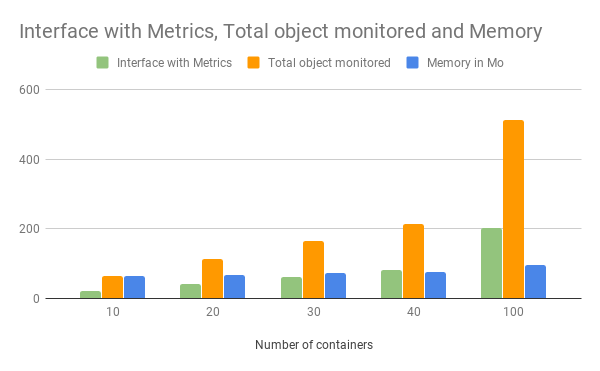
What about memory ?
The following graph will show the number of objects monitored per network namespace and the memory used for each density.
But with real containers…
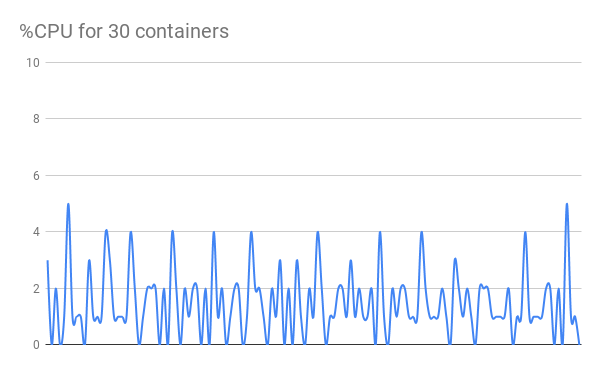
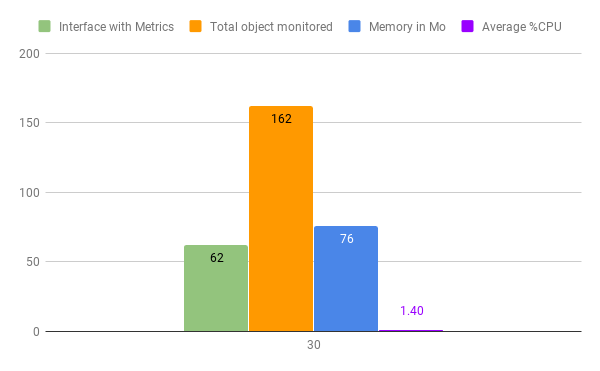
Until now I used our “sandbox” script, but what will it be with real container ? For this test I just started 30 containers in a loop.
for i in $( seq 30 ); do docker run busybox sleep 160 & doneWhich gives…
The following video shows how the containers are detected and reported by Skydive.
Conclusion
Of course there is still some work that can be done to improve the performances, but the overhead is already low and we can play with the sample rate parameter to lower it down even more.