Skydive Flow matrix
by Nicolas Planel, 24/07/2018Skydive Flow Matrix is a tool on top of Skydive that helps you understand which services are connecting to each other on your platform. Thanks to the Skydive SocketInfo probe, Flow Matrix will report all opened Sockets between client and server processes across hosts.
This can be used to answer questions like :
- Which services are using the network on my platform?
- Which services are communicating with each other on my platform?
- Once I develop expected answers to these questions, could I automatically detect when it changes through automated testing?
In this post, we present a use case for these capabilities, determining the map of communication between services in a simple OpenStack cloud environment.
OpenStack is a cloud computing platform that includes services to provide compute, networking, and storage on a cloud of 10s, 100s, or 1000s of nodes. OpenStack is also a complex distributed system with many services running across those nodes. We were recently asked if Skydive could be used to demonstrate exactly which services were communicating and this post shows how we answered that question.
Demonstration using OpenStack
To demonstrate Skydive and Flow matrix, we will use a 2-node deployment using Devstack. This includes an all-in-one node plus an additional compute node. The Devstack configuration (local.conf) files needed are included in the Skydive git repository.
Flow matrix relies on the socketinfo probe so we need to enable it by adding the following line in the local.conf files for both nodes:
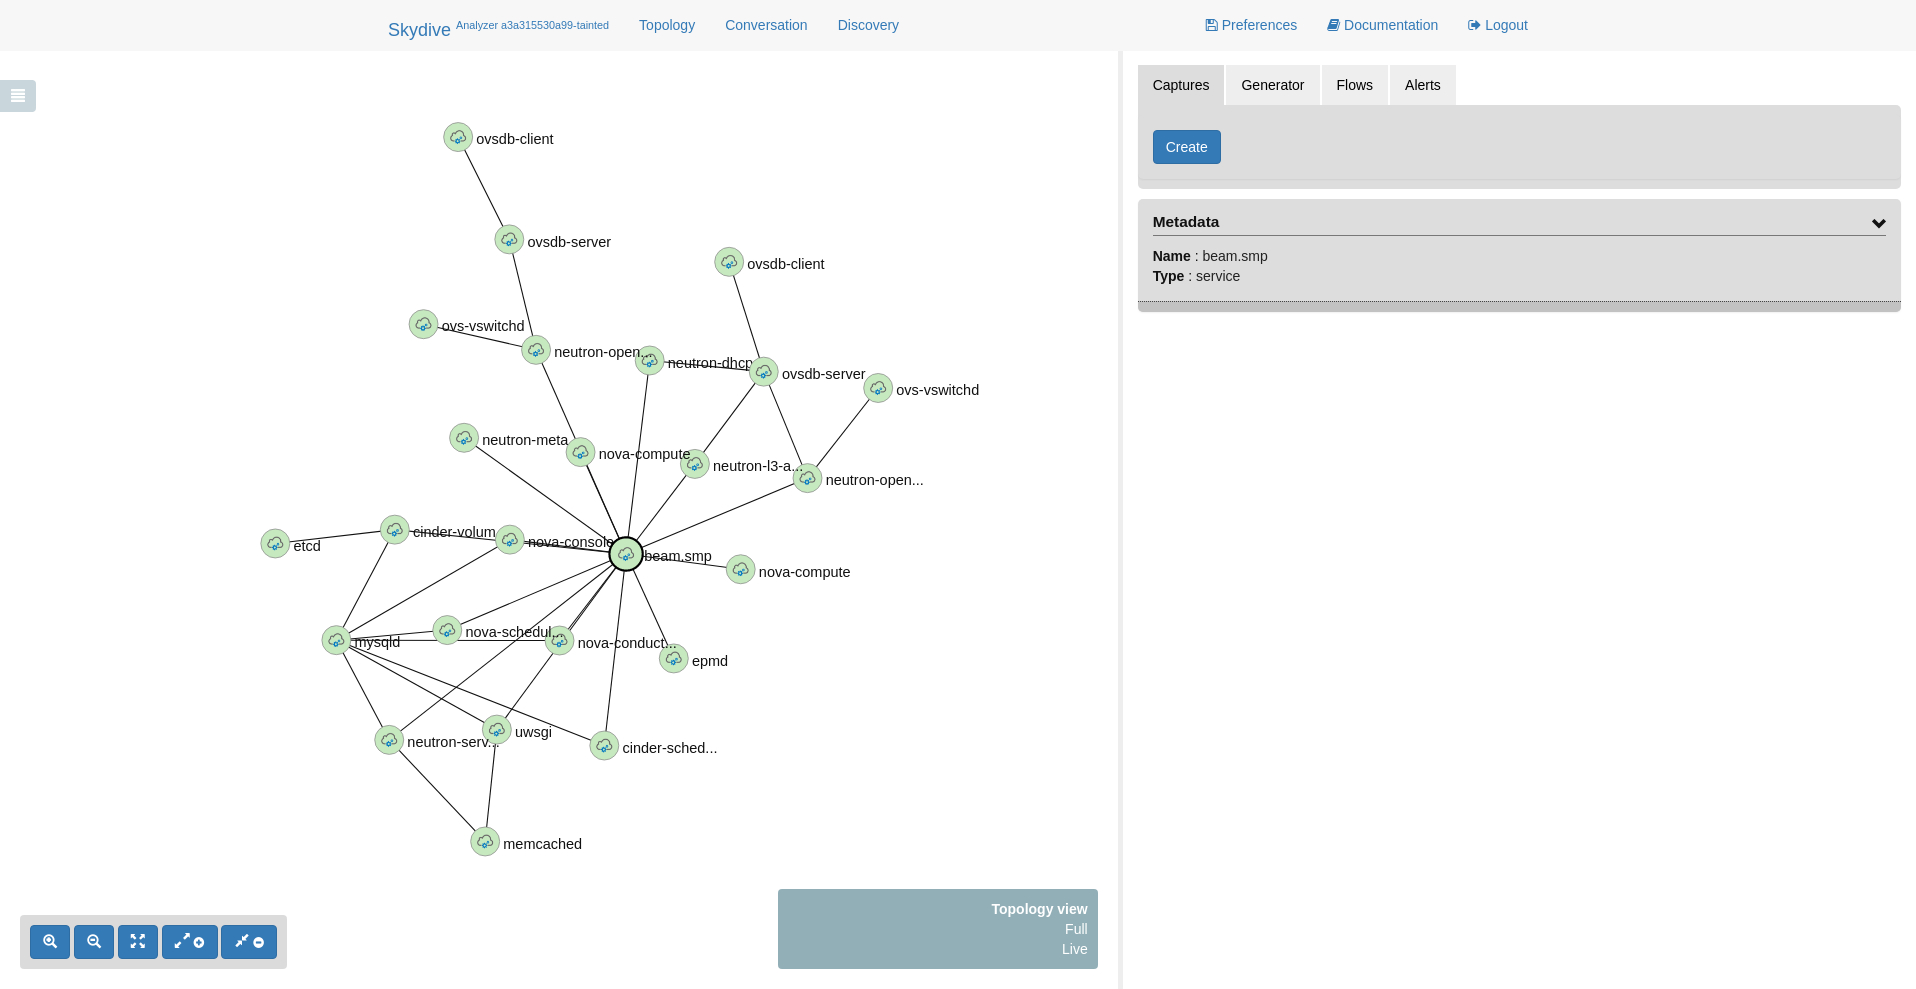
SKYDIVE_AGENT_PROBES=”ovsdb neutron socketinfo”Once the deployment is complete, here is the view in the Skydive UI:
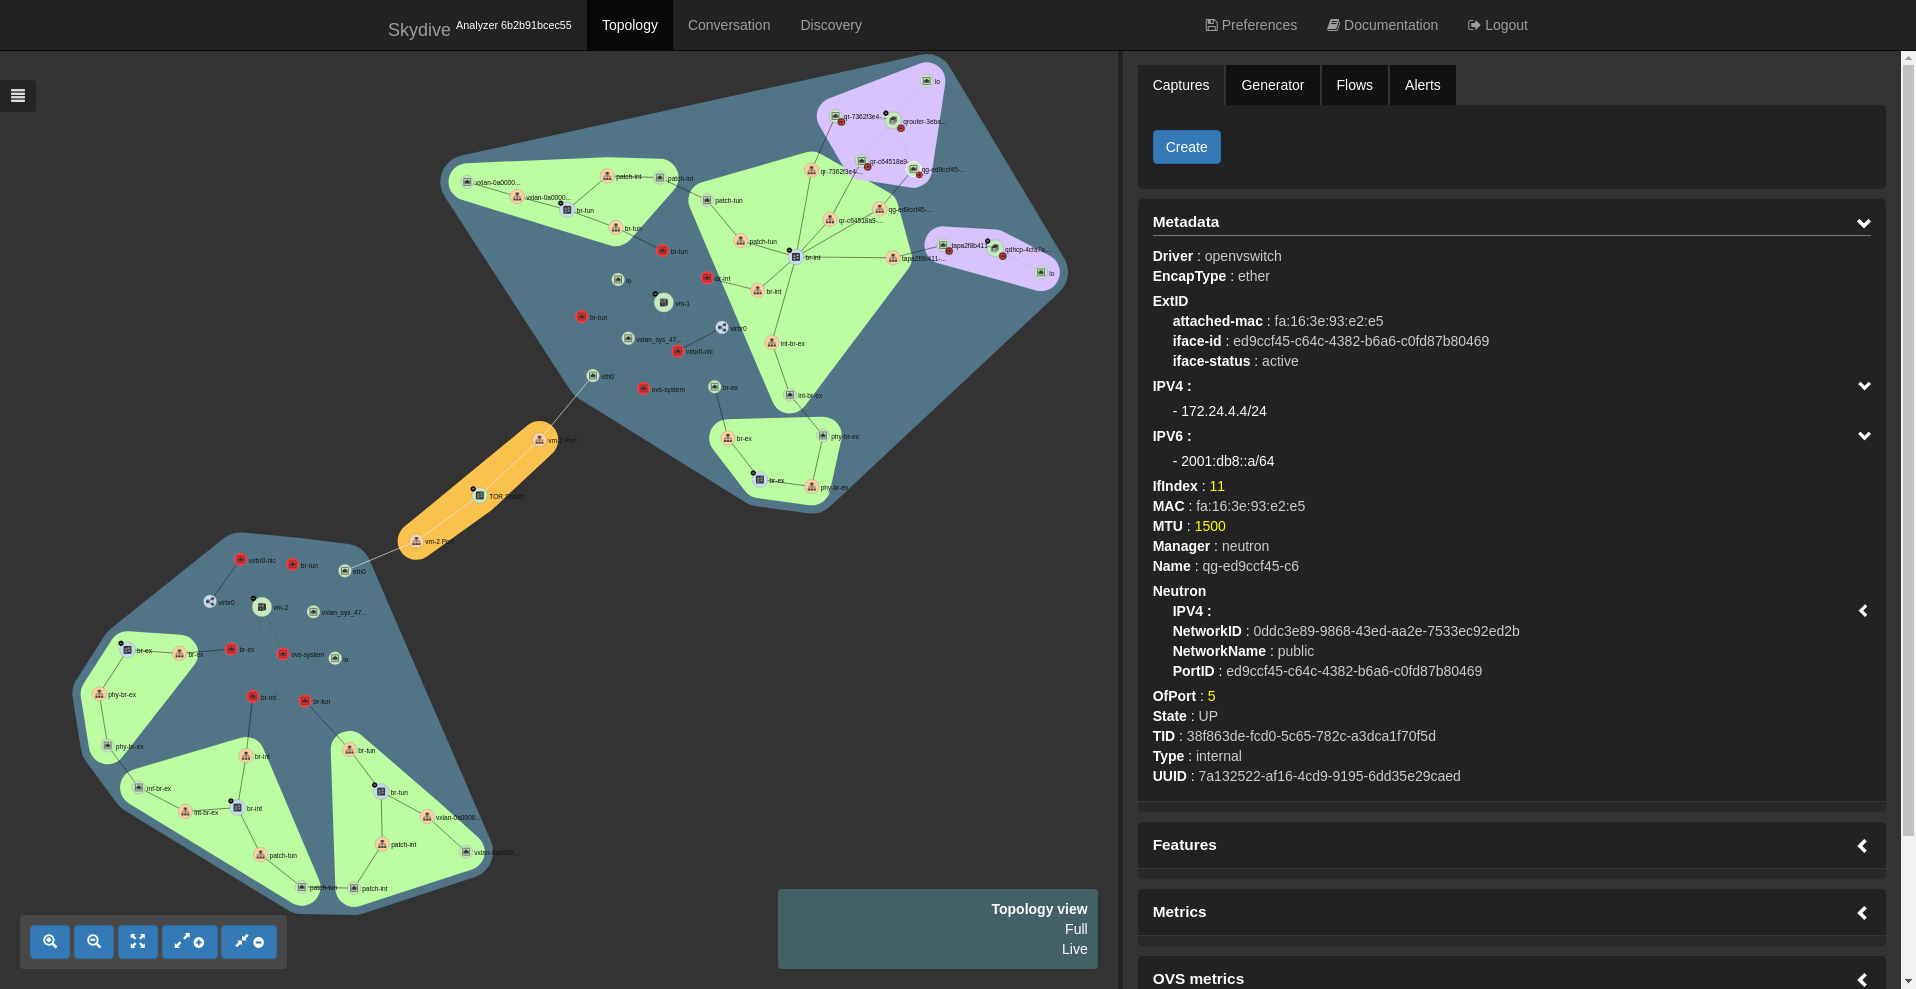
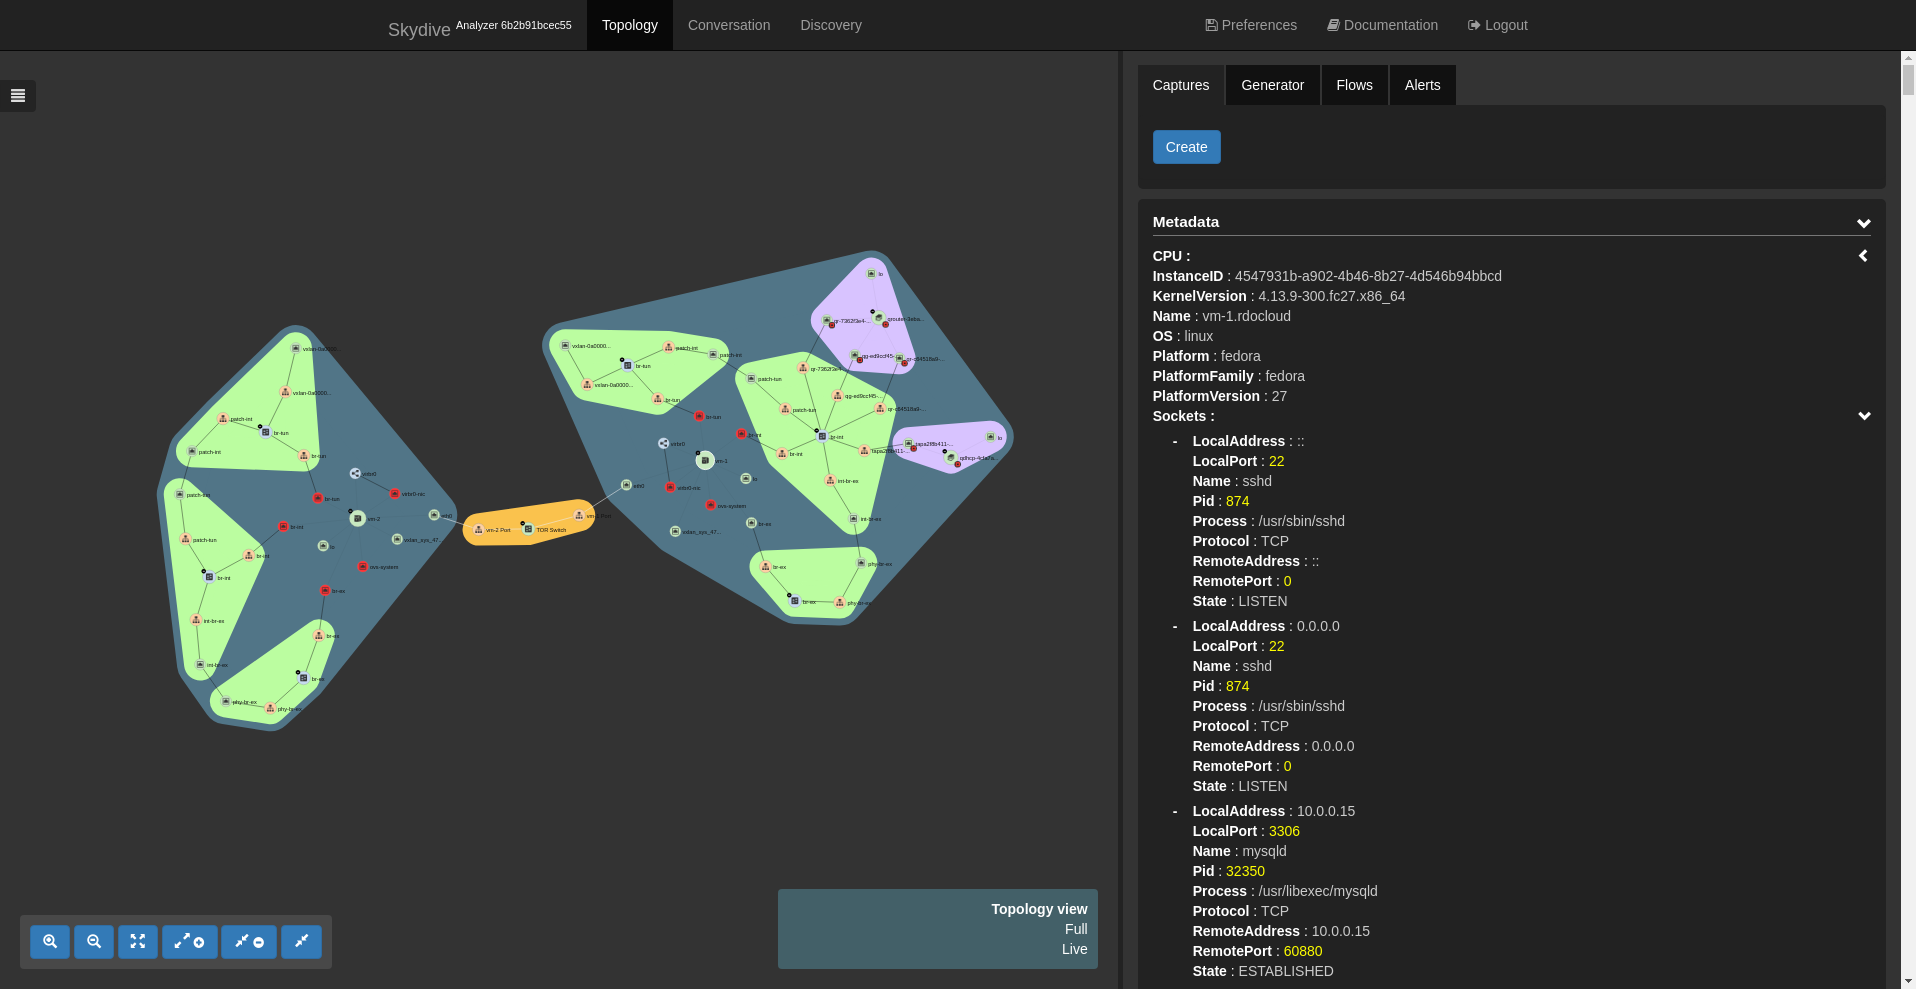
We can then take a look at the additional information collected by the socketinfo probe. Click on a host node to select it. The metadata for the node will be shown in the right panel. There should now be a sockets field that can be expanded to get all connection information.
Now that the socket metadata is available, let’s run flow matrix on top of it.
Flow Matrix installation
git clone https://github.com/skydive-project/skydive-flow-matrix.git
cd skydive-flow-matrix
virtualenv .venv
source .venv/bin/activate
pip install -r requirements.txt
pip install .
Flow Matrix usage
skydive-flow-matrix --analyzer 10.0.0.15:8082 --username admin --password password| Protocol | Service Host | Service Address | Service Port | Service Path | Service Name | Client Host | Client Address | Client Path | Client Name |
|---|---|---|---|---|---|---|---|---|---|
| TCP | vm-1 | 10.0.0.15 | 5672 | …/erts/bin/beam.smp | beam.smp | vm-1 | 10.0.0.15 | …/bin/python2.7 | cinder-volume |
| UDP | vm-1 | 10.0.0.15 | 8082 | …/bin/skydive | skydive | vm-1 | 10.0.0.15 | …/bin/skydive | skydive |
| TCP | vm-1 | 10.0.0.15 | 8082 | …/bin/skydive | skydive | vm-1 | 10.0.0.15 | …/bin/skydive | skydive |
| TCP | vm-1 | 10.0.0.15 | 3306 | …/bin/mysqld | mysqld | vm-1 | 10.0.0.15 | …/bin/uwsgi | uwsgi |
| TCP | vm-1 | 10.0.0.15 | 5672 | …/erts/bin/beam.smp | beam.smp | vm-1 | 10.0.0.15 | …/bin/python2.7 | neutron-l3-agen |
| TCP | vm-1 | 10.0.0.15 | 5672 | …/erts/bin/beam.smp | beam.smp | vm-1 | 10.0.0.15 | …/bin/python2.7 | neutron-metadat |
| TCP | vm-1 | 127.0.0.1 | 11211 | …/bin/memcached | memcached | vm-1 | 127.0.0.1 | …/bin/python2.7 | neutron-server |
| TCP | vm-1 | 10.0.0.15 | 8082 | …/bin/skydive | skydive | vm-2 | 10.0.0.14 | …/bin/skydive | skydive |
| TCP | vm-1 | 10.0.0.15 | 3306 | …/bin/mysqld | mysqld | vm-1 | 10.0.0.15 | …/bin/python2.7 | cinder-schedule |
| TCP | vm-2 | 127.0.0.1 | 4369 | …/erts/bin/epmd | epmd | vm-2 | 127.0.0.1 | …/erts/bin/beam.smp | beam.smp |
| TCP | vm-2 | 127.0.0.1 | 4369 | …/erts/bin/epmd | epmd | vm-1 | 127.0.0.1 | …/erts/bin/beam.smp | beam.smp |
| TCP | vm-1 | 10.0.0.15 | 5672 | …/erts/bin/beam.smp | beam.smp | vm-1 | 10.0.0.15 | …/bin/python2.7 | nova-consoleaut |
| TCP | vm-1 | 10.0.0.15 | 3306 | …/bin/mysqld | mysqld | vm-1 | 10.0.0.15 | …/bin/python2.7 | nova-scheduler |
| TCP | vm-1 | 10.0.0.15 | 5672 | …/erts/bin/beam.smp | beam.smp | vm-1 | 10.0.0.15 | …/bin/python2.7 | cinder-schedule |
| UDP | vm-1 | 10.0.0.15 | 8082 | …/bin/skydive | skydive | vm-2 | 10.0.0.14 | …/bin/skydive | skydive |
| TCP | vm-1 | 127.0.0.1 | 9200 | …/bin/java | java | vm-1 | 127.0.0.1 | …/bin/skydive | skydive |
| TCP | vm-2 | 127.0.0.1 | 6640 | …/ovsdb-server | ovsdb-server | vm-1 | 127.0.0.1 | …/bin/python2.7 | neutron-dhcp-ag |
| TCP | vm-1 | 10.0.0.15 | 5672 | …/erts/bin/beam.smp | beam.smp | vm-2 | 10.0.0.14 | …/bin/python2.7 | nova-compute |
| TCP | vm-2 | 127.0.0.1 | 6640 | …/ovsdb-server | ovsdb-server | vm-2 | 127.0.0.1 | …/bin/python2.7 | neutron-openvsw |
| TCP | vm-1 | 10.0.0.15 | 5672 | …/erts/bin/beam.smp | beam.smp | vm-1 | 10.0.0.15 | …/bin/python2.7 | neutron-openvsw |
| TCP | vm-1 | 10.0.0.15 | 12379 | …/bin/skydive | skydive | vm-1 | 10.0.0.15 | …/bin/skydive | skydive |
| TCP | vm-2 | 127.0.0.1 | 6640 | …/ovsdb-server | ovsdb-server | vm-1 | 127.0.0.1 | …/bin/python2.7 | neutron-l3-agen |
| TCP | vm-1 | 10.0.0.15 | 2379 | …/etcd | etcd | vm-1 | 10.0.0.15 | …/bin/python2.7 | cinder-volume |
| TCP | vm-1 | 10.0.0.15 | 2379 | …/etcd | etcd | vm-1 | 10.0.0.15 | …/etcd | etcd |
| TCP | vm-1 | 10.0.0.15 | 5672 | …/erts/bin/beam.smp | beam.smp | vm-1 | 10.0.0.15 | …/bin/uwsgi | uwsgi |
| TCP | vm-1 | 10.0.0.15 | 5672 | …/erts/bin/beam.smp | beam.smp | vm-1 | 10.0.0.15 | …/bin/python2.7 | neutron-dhcp-ag |
| TCP | vm-1 | 10.0.0.15 | 3306 | …/bin/mysqld | mysqld | vm-1 | 10.0.0.15 | …/bin/python2.7 | cinder-volume |
| TCP | vm-2 | 127.0.0.1 | 6633 | …/bin/python2.7 | neutron-openvsw | vm-2 | 127.0.0.1 | …/ovs-vswitchd | ovs-vswitchd |
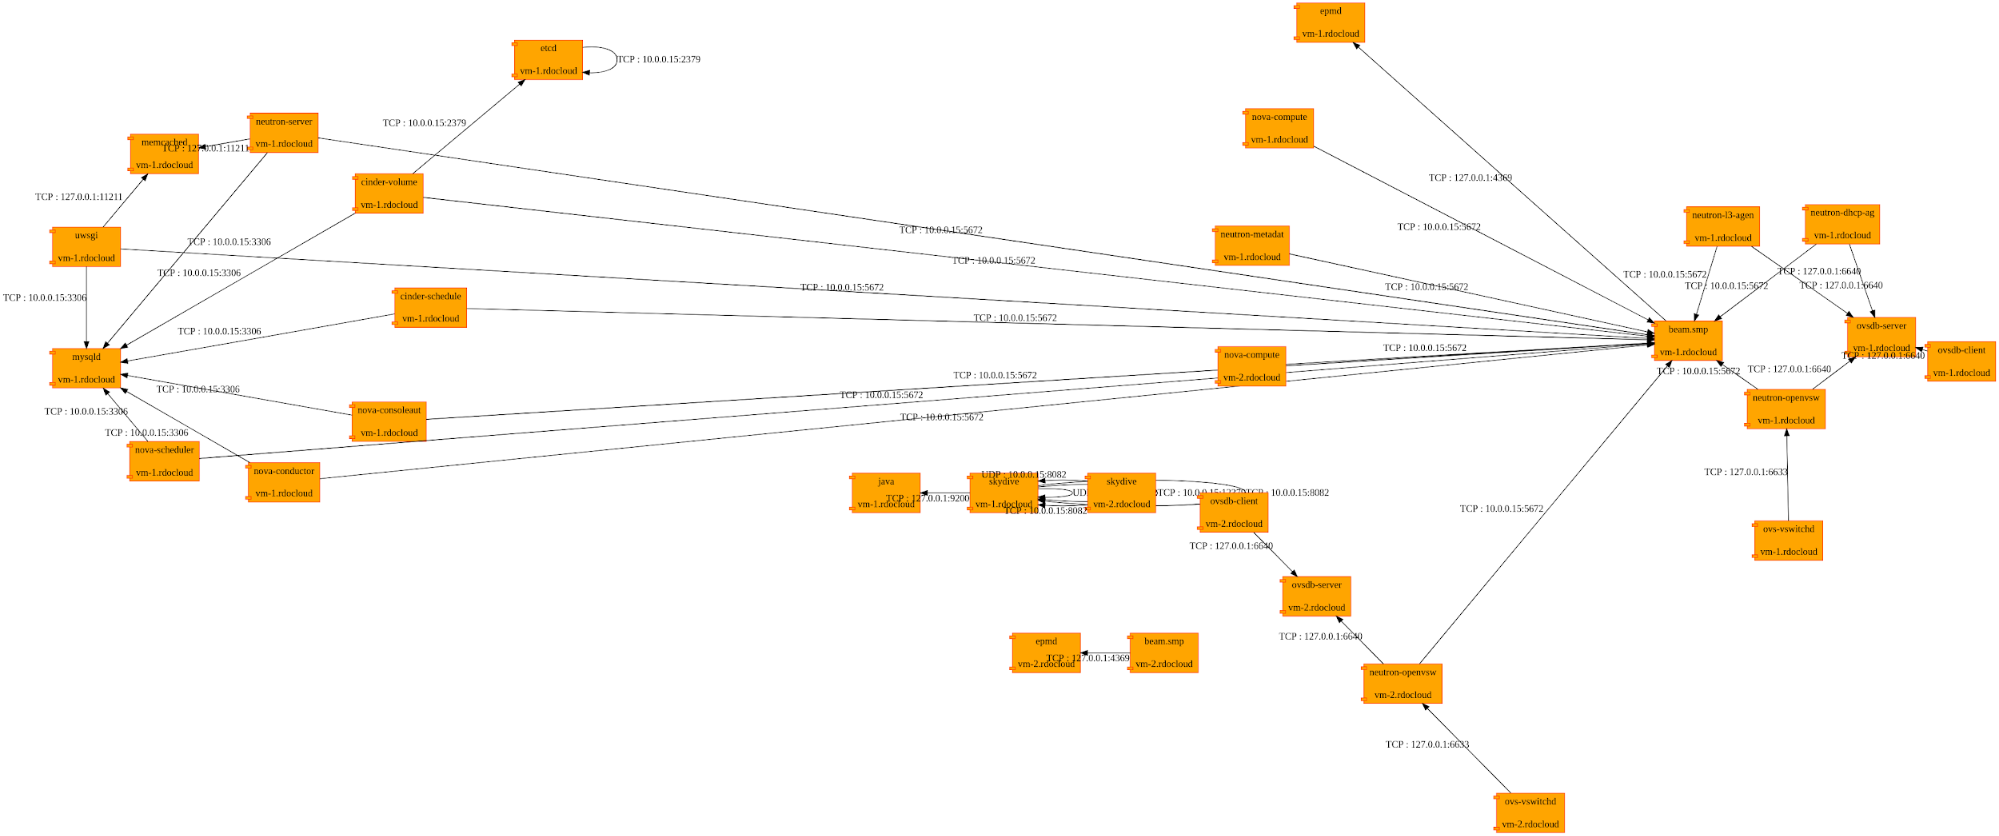
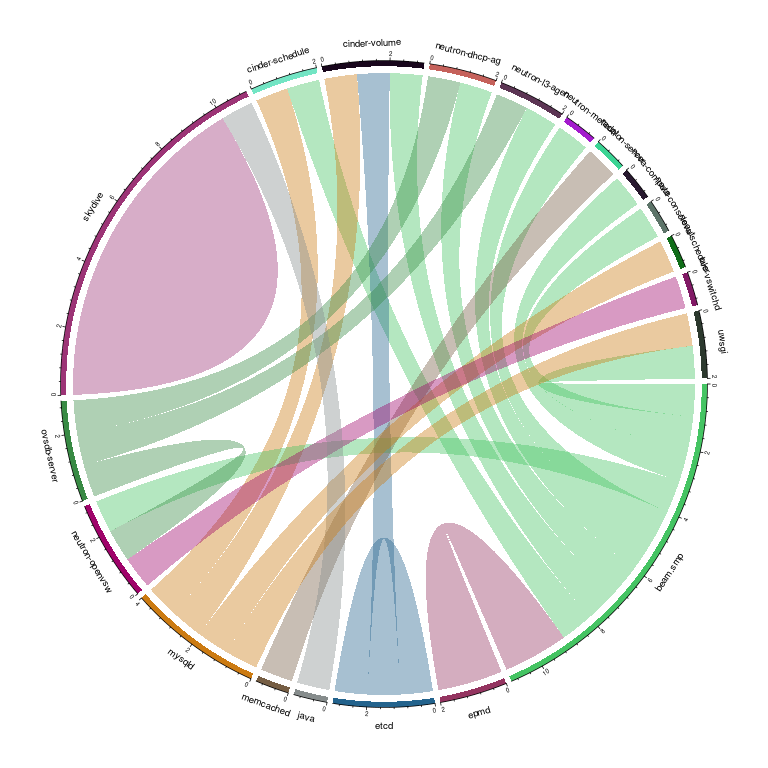
Flow matrix supports multiple output format, by default it will return an CSV output, but you can use the dot output or one of the dot rendering engine available.
skydive-flow-matrix --analyzer 10.0.0.15:8082 --username admin --password password --format render --engine circoAll the available engines are listed with the command line help
skydive-flow-matrix --help

usage: matrix.py [-h] --analyzer ANALYZER [--username USERNAME]
                 [--password PASSWORD] [--ssl] [--insecure] [--use-flows]
                 [--at AT] [--duration DURATION] [--list-no-peers]
                 [--format {csv,dot,render,skydive}]
                 [--engine {dot,circo,neato}
Here some examples using different engines :
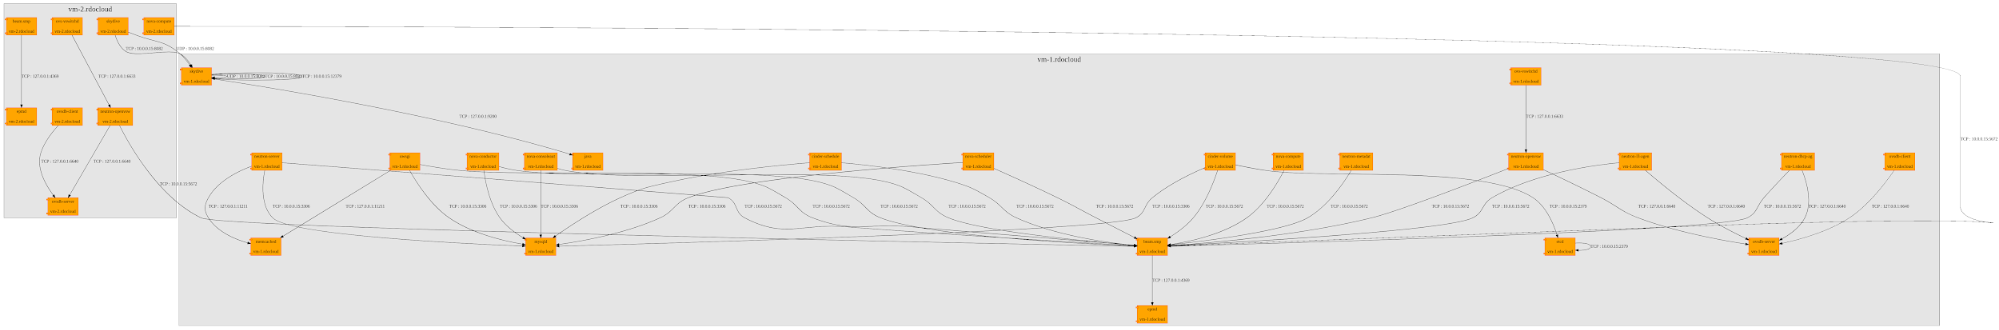
There is also a format called Skydive, this format will inject the flow matrix within a Skydive analyzer. For that you just need to start a local analyzer and to run the flow matrix tool with the skydive format.
How does this work ?
The flow matrix tool leverages the information that the socketinfo probe collects in order to build the flow matrix. On each Skydive agent, the socketinfo probe listens for socket creation and the state of the connection and stores the socket details as host node metadata.
They are available through the API and the command line. The following command line gives all the socket information available for all the host monitored by Skydive.
$ skydive client query "G.V().Sockets()"

	...
	{
		"LocalAddress": "127.0.0.1",
		"LocalPort": 323,
		"RemoteAddress": "0.0.0.0",
		"RemotePort": 0,
		"Protocol": "UDP",
		"State": "CLOSE",
		"Process": ".../chronyd",
		"Pid": 1135,
		"Name": "chronyd"
	},
	{
		"LocalAddress": "127.0.0.1",
		"LocalPort": 631,
		"RemoteAddress": "0.0.0.0",
		"RemotePort": 0,
		"Protocol": "TCP",
		"State": "LISTEN",
		"Process": ".../cupsd",
		"Pid": 1445,
		"Name": "cupsd"
	},
	...
You can also filter to see only a processes using a specific protocol
skydive client query "G.V().Sockets().Has('Protocol', 'UDP')"

	...
	{
		"LocalAddress": "0.0.0.0",
		"LocalPort": 111,
		"RemoteAddress": "0.0.0.0",
		"RemotePort": 0,
		"Protocol": "UDP",
		"State": "CLOSE",
		"Process": "/usr/lib/systemd/systemd",
		"Pid": 1,
		"Name": "systemd"
	},
	{
		"LocalAddress": "xxx.xxx.xxx.xxx",
		"LocalPort": 34489,
		"RemoteAddress": "xxx.xxx.xxx.xxx",
		"RemotePort": 443,
		"Protocol": "UDP",
		"State": "ESTABLISHED",
		"Process": "/opt/google/chrome/chrome",
		"Pid": 2796,
		"Name": "chrome"
	},
	...
Or a specific port
skydive client query "G.V().Sockets().Has('RemotePort', 443)"

	...
	{
		"LocalAddress": "xxx.xxx.xxx.xxx",
		"LocalPort": 43888,
		"RemoteAddress": "xxx.xxx.xxx.xxx",
		"RemotePort": 443,
		"Protocol": "TCP",
		"State": "ESTABLISHED",
		"Process": "/opt/google/chrome/chrome",
		"Pid": 2796,
		"Name": "chrome"
	},
	{
		"LocalAddress": "xxx.xxx.xxx.xxx",
		"LocalPort": 40532,
		"RemoteAddress": "xxx.xxx.xxx.xxx",
		"RemotePort": 443,
		"Protocol": "TCP",
		"State": "ESTABLISHED",
		"Process": "/opt/google/chrome/chrome",
		"Pid": 2796,
		"Name": "chrome"
	},
	...
Of course the information are available in the WebUI as host metadata.
As we saw that Skydive collects socket information it is easy to do a simple match between clients and servers using the classical 5-tuples.
Conclusion
As we saw the SocketInfo probe is a really powerful probe that can be used to monitor processes creation and communication, unexpected port usage or protocol, etc. As Skydive stores all the events in a datastore a such analysis can be done for past events as well.
In a follow-up post we will show how the Workflow feature that we recently introduced can be leveraged to have the flow matrix being part of Skydive and not as an external tool.