8. Skydive as Grafana datasource
One key feature of `Skydive` is the ability to keep track of all the modifications of the topology. This is true for the Flow meaning packet capture as well. In this tutorial we will see how to leverage this with `Grafana` in order to graph metrics such as `sFlow`, `OpenvSwitch`, RTT metrics.
Skydive setup
In order to have the Skydive history working we need to setup a storage backend. To do so please check the
History and Datastore section.
For the purpose of this example we will use a sandbox
script
that we provide in the Skydive repository.
This script requires to have OpenvSwitch up and running. It will create 2 network namespaces connected through a OpenvSwitch bridge.
./scripts/simple.sh start 192.168.0.1/24 192.168.0.2/24
To remove/delete the sandbox it will be :
./scripts/simple.sh stop
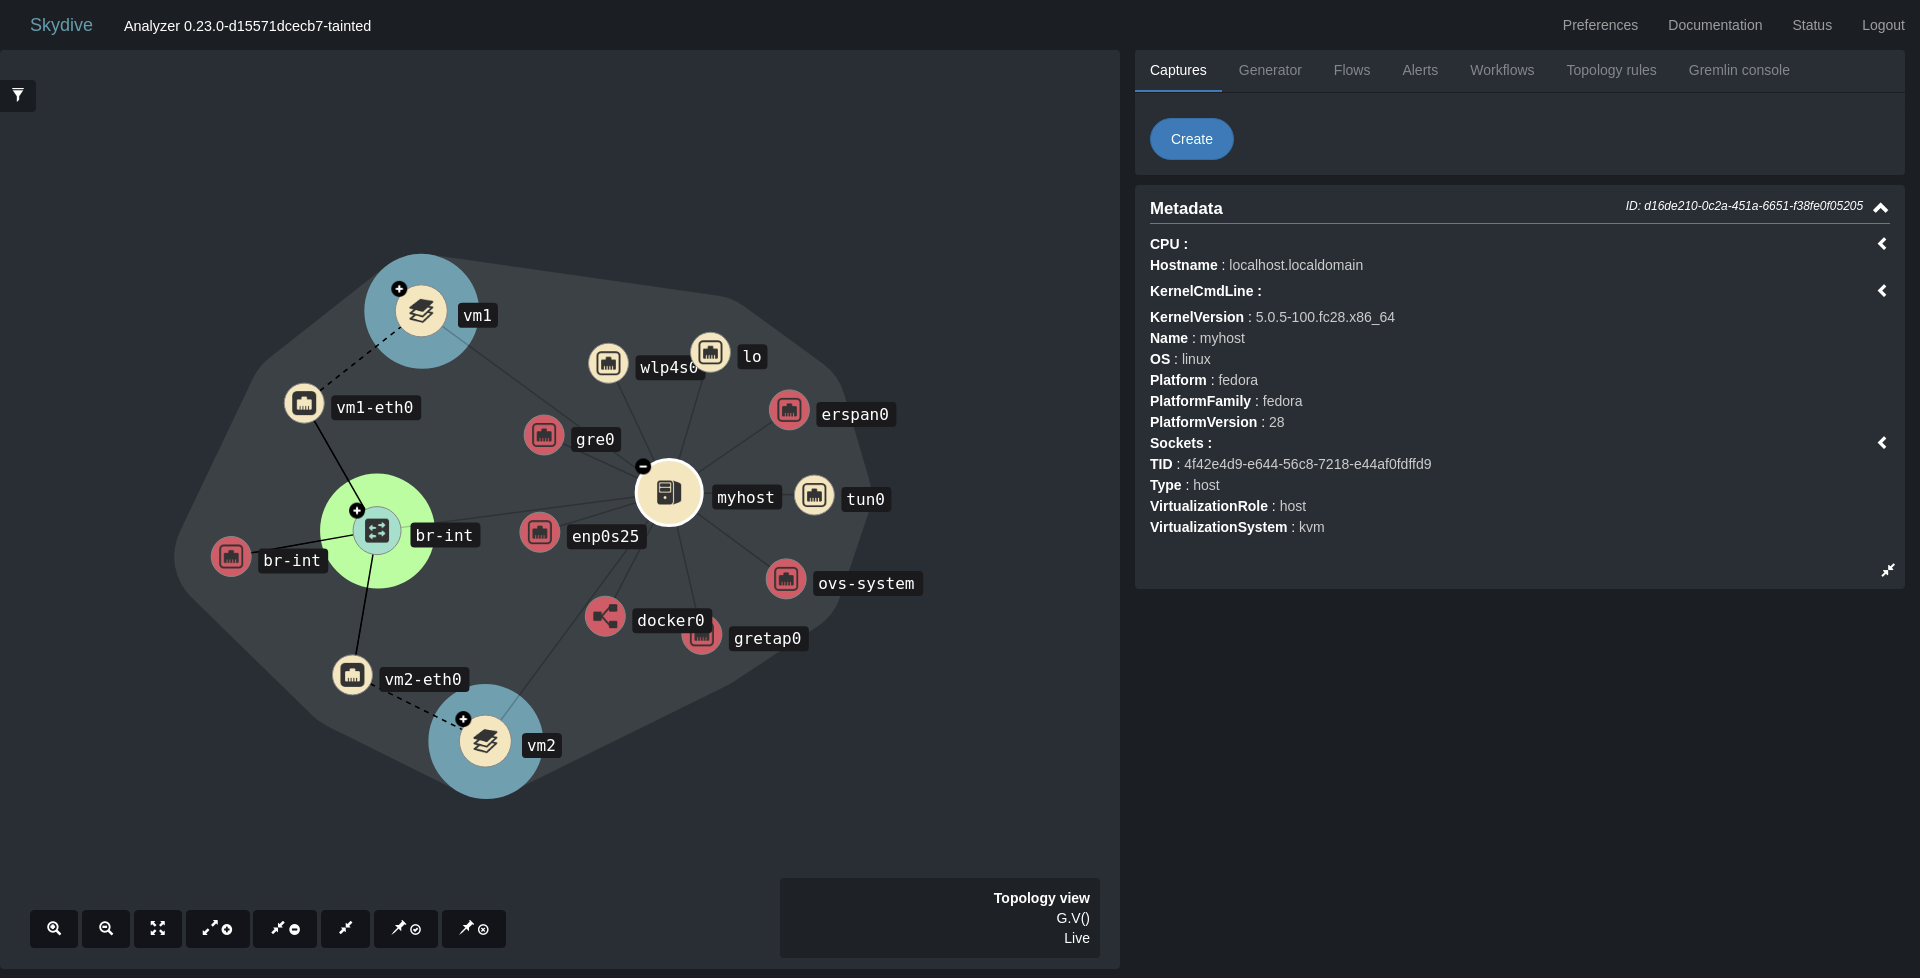
Taking a look at the Skydive WebUI we get the following topology.
Grafana
We do provide a Grafana Docker
image
with the Skydive datasource enabled by default. Starting Grafana with Skydive is fairly simple.
docker run -d --name=grafana --net=host skydive/skydive-grafana-datasource
The default user/password is admin/admin.
We use the host networking so that Grafana will have access to our local Skydive.
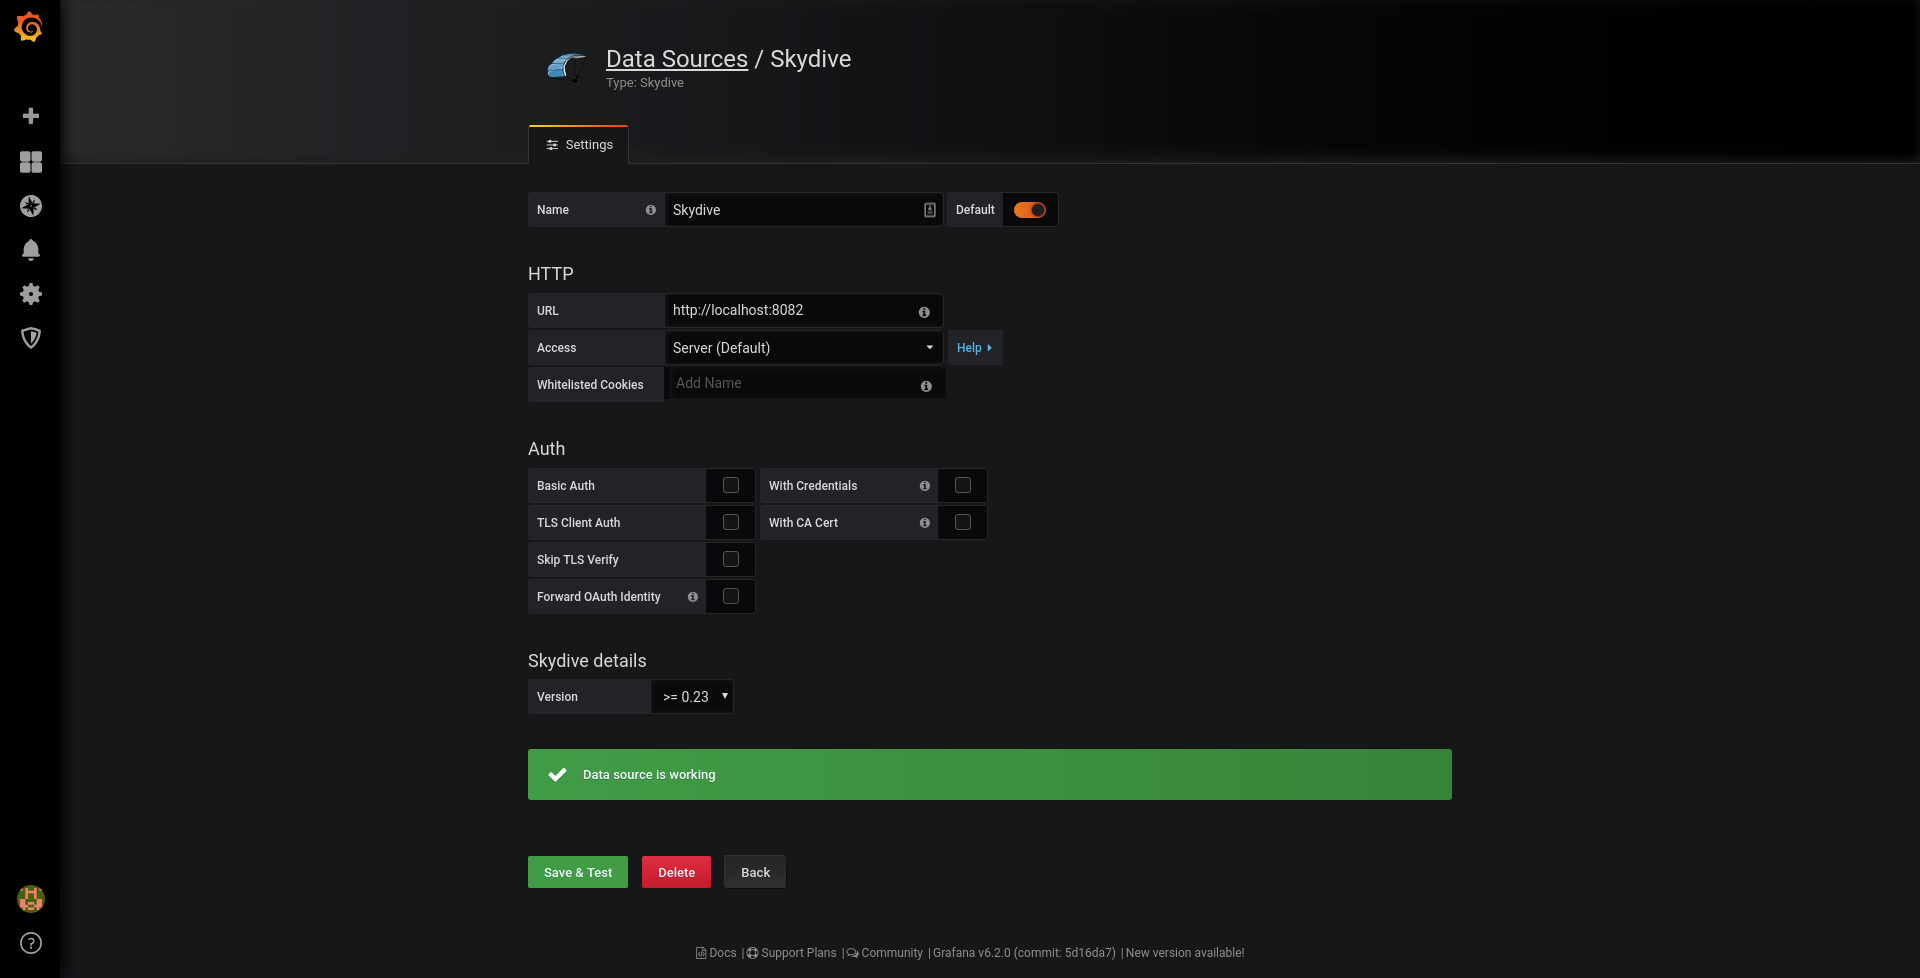
Skydive as datasource
The Skydive datasource has to be add as the other Grafana datasources. The configuration will be really simple, we just
need to enter the Skydive Analyzer endpoint (http://localhost:8082, by default).
First Graph, Interface Metrics
In order to have something to graph in Grafana we need to generate some traffic. We could make a simple ping
from one namespace to the other :
sudo ip netns exec vm1 ping 192.168.0.2 -s 512
But We would rather use the packet injector.
Now we have traffic we can go to Grafana to get it graph. The Skydive datasource is using the same language used for its API. It means that
you can select the metrics using the Gremlin query language.
In order to graph our packets we will select on veth pair belonging the a namespace.
G.V().Has('Name', 'vm1-eth0')
In the query editor it will look like :
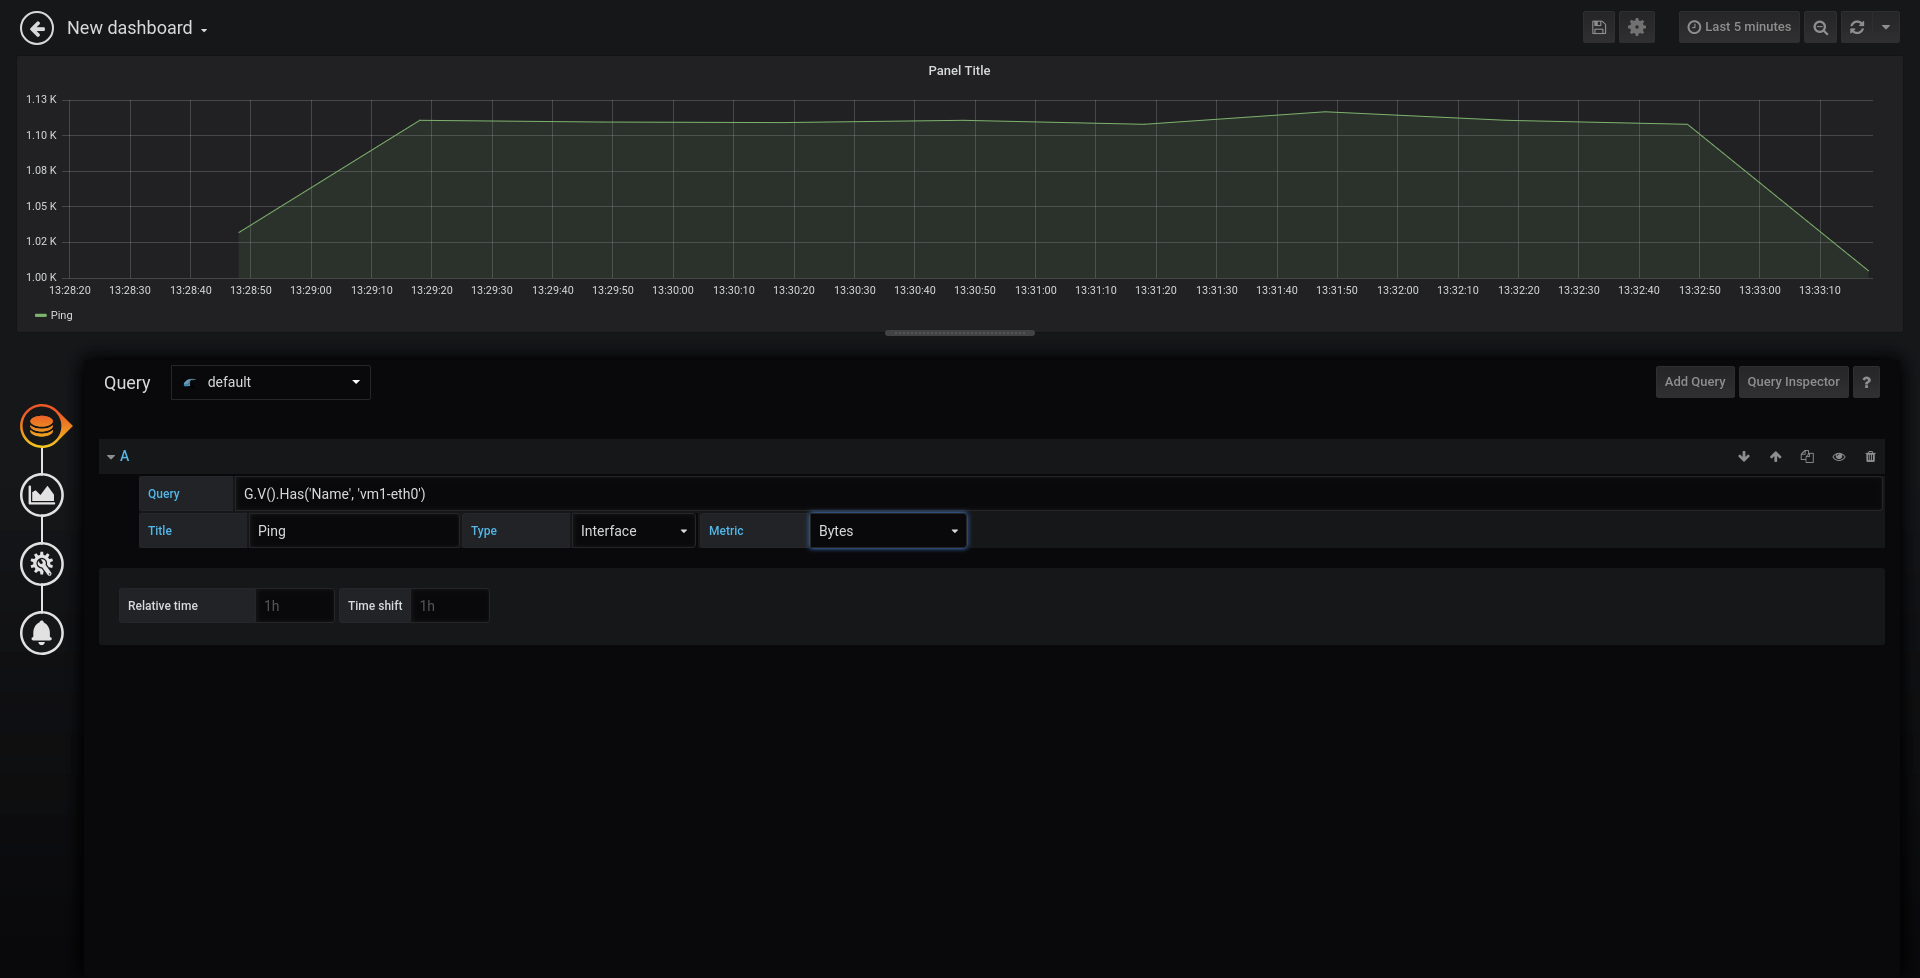
Here we used the Interface metrics but we could use the OpenvSwitch metrics as well, this is just a matter of select
the Type.
Packet capture, sFlow, RTT, etc.
So we used the Interfaces metrics to graph the traffic but as Skydive is also about capture we will graph using this feature
in the following examples.
OpenvSwitch sFlow capture
In order to get sFlow packet from OpenvSwitch we need to start a capture on the bridge. Skydive will select sFlow by default with default
polling rate and sampling rate. This can be adapted using the advanced options.
The Gremlin expression in the query editor will be as following with the sFlow :
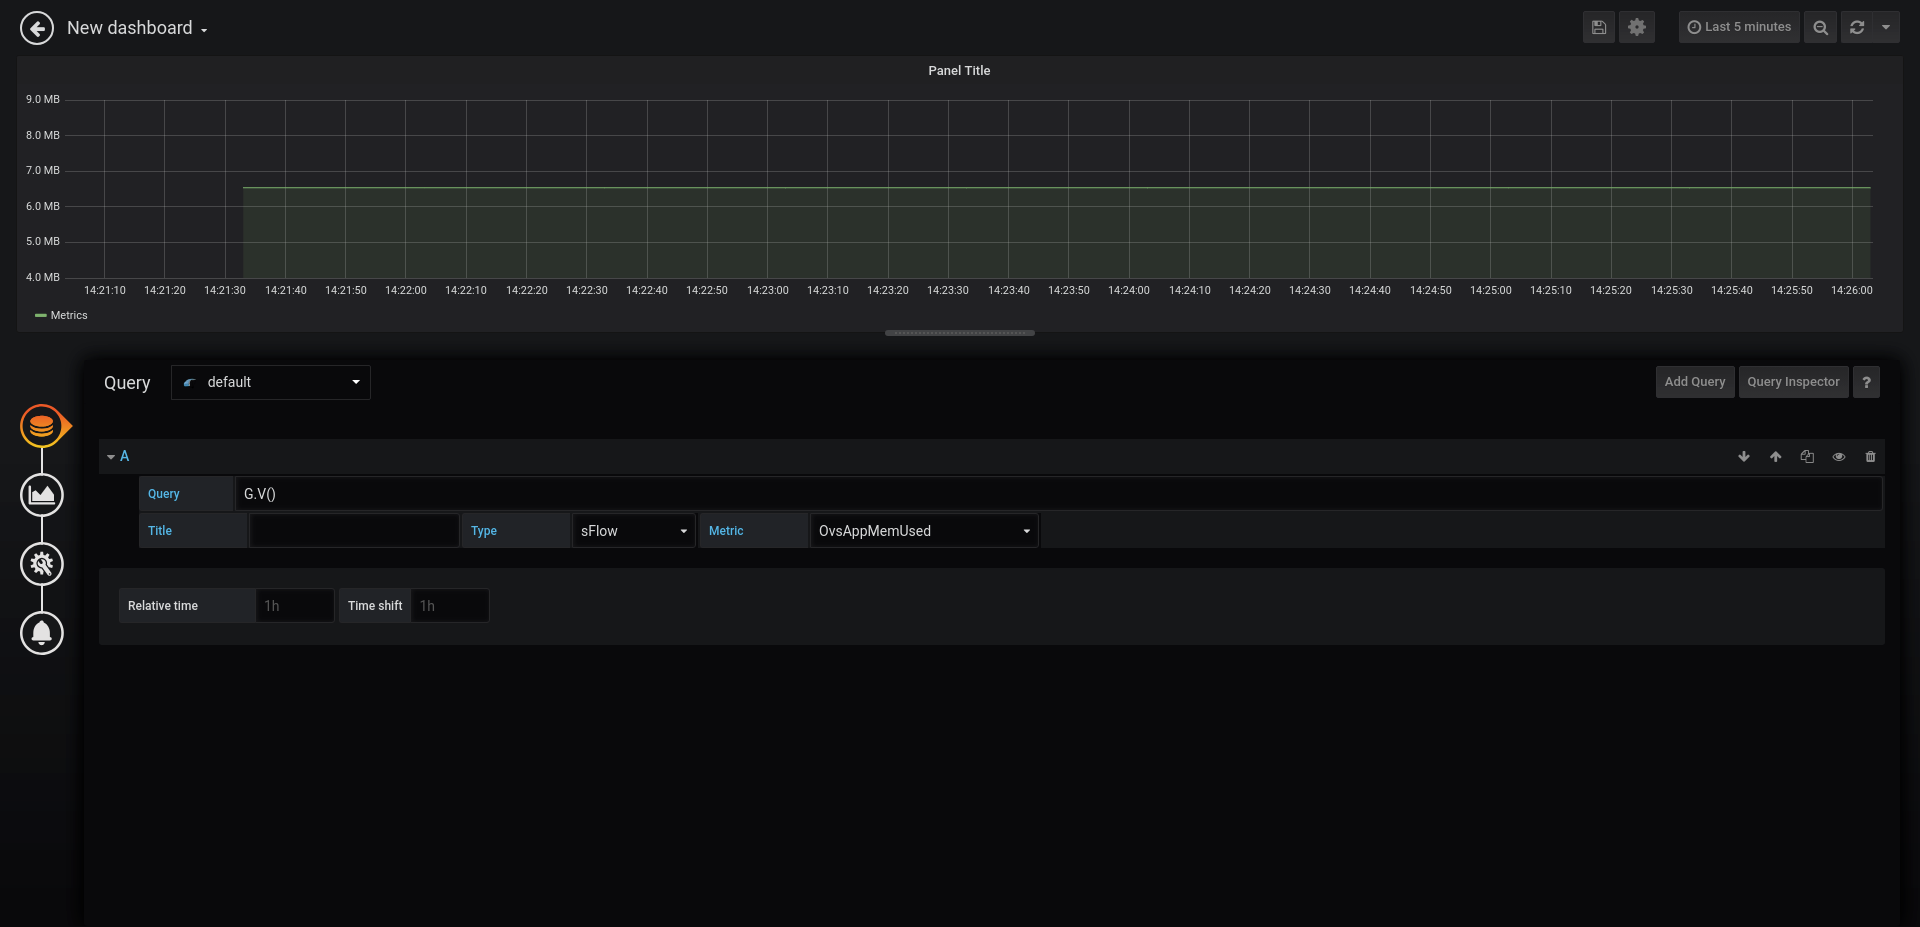
OpenvSwitch reports also internal information like the memory used :
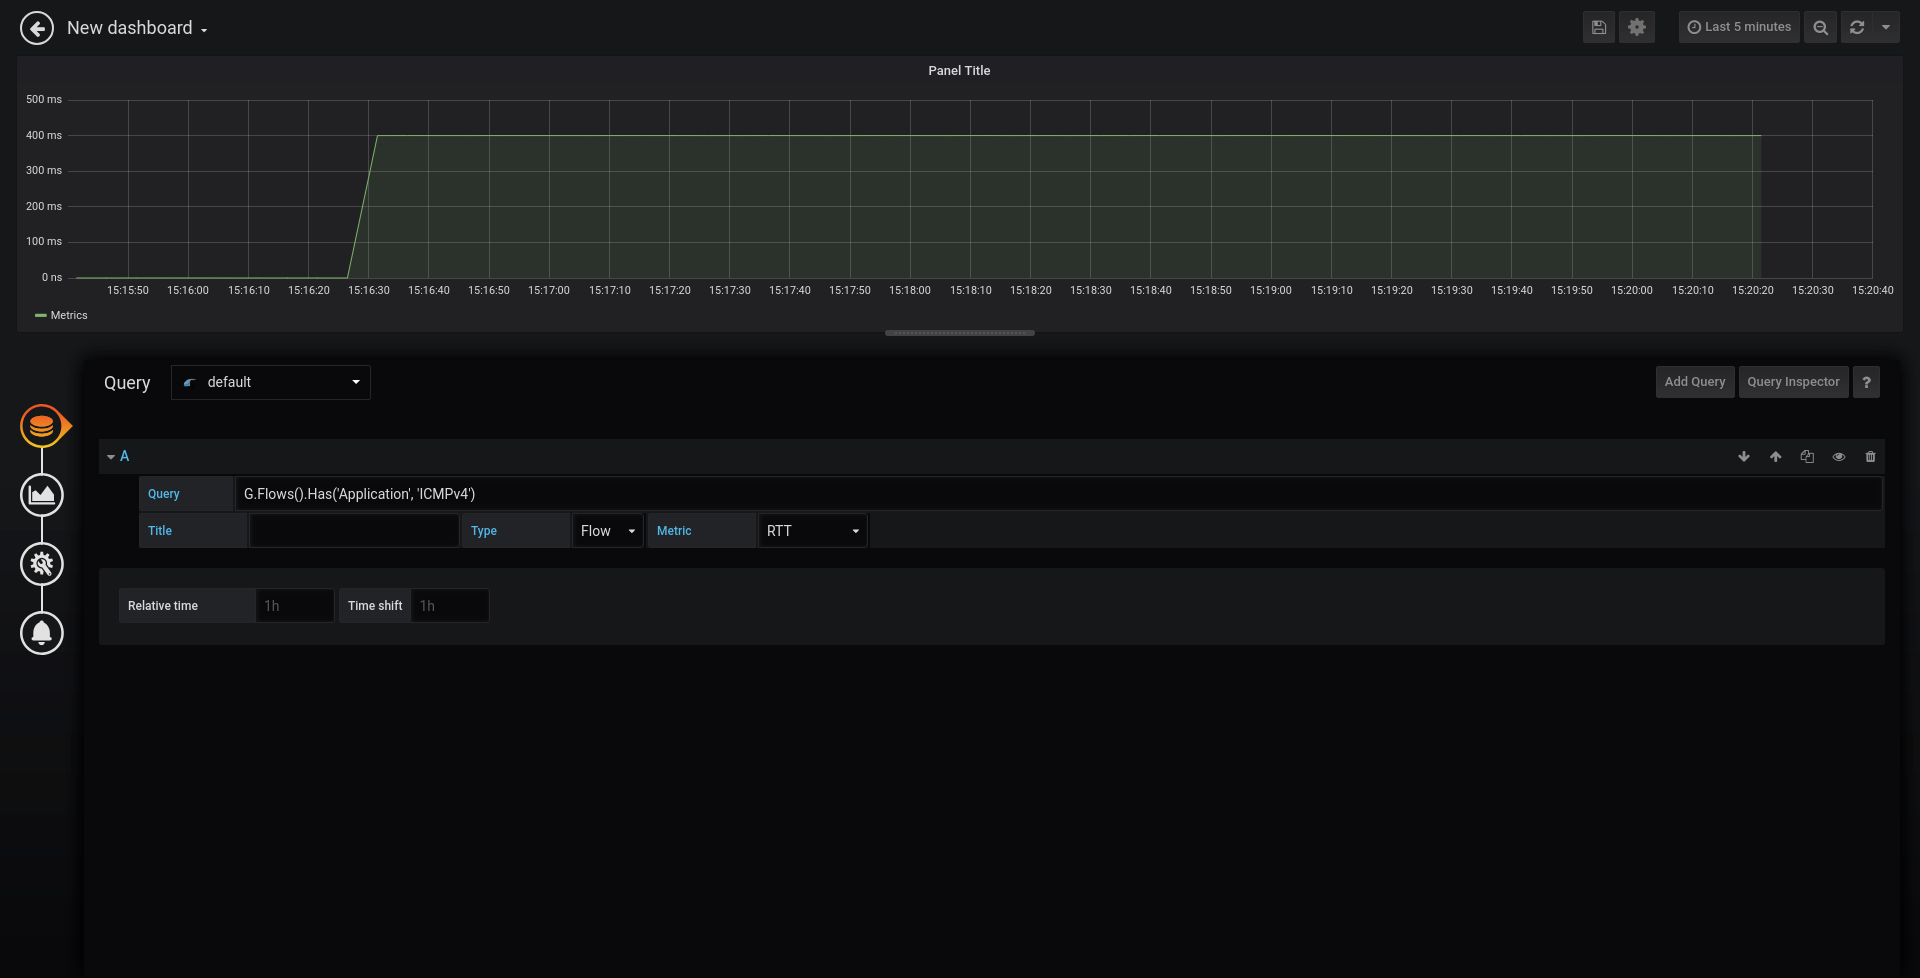
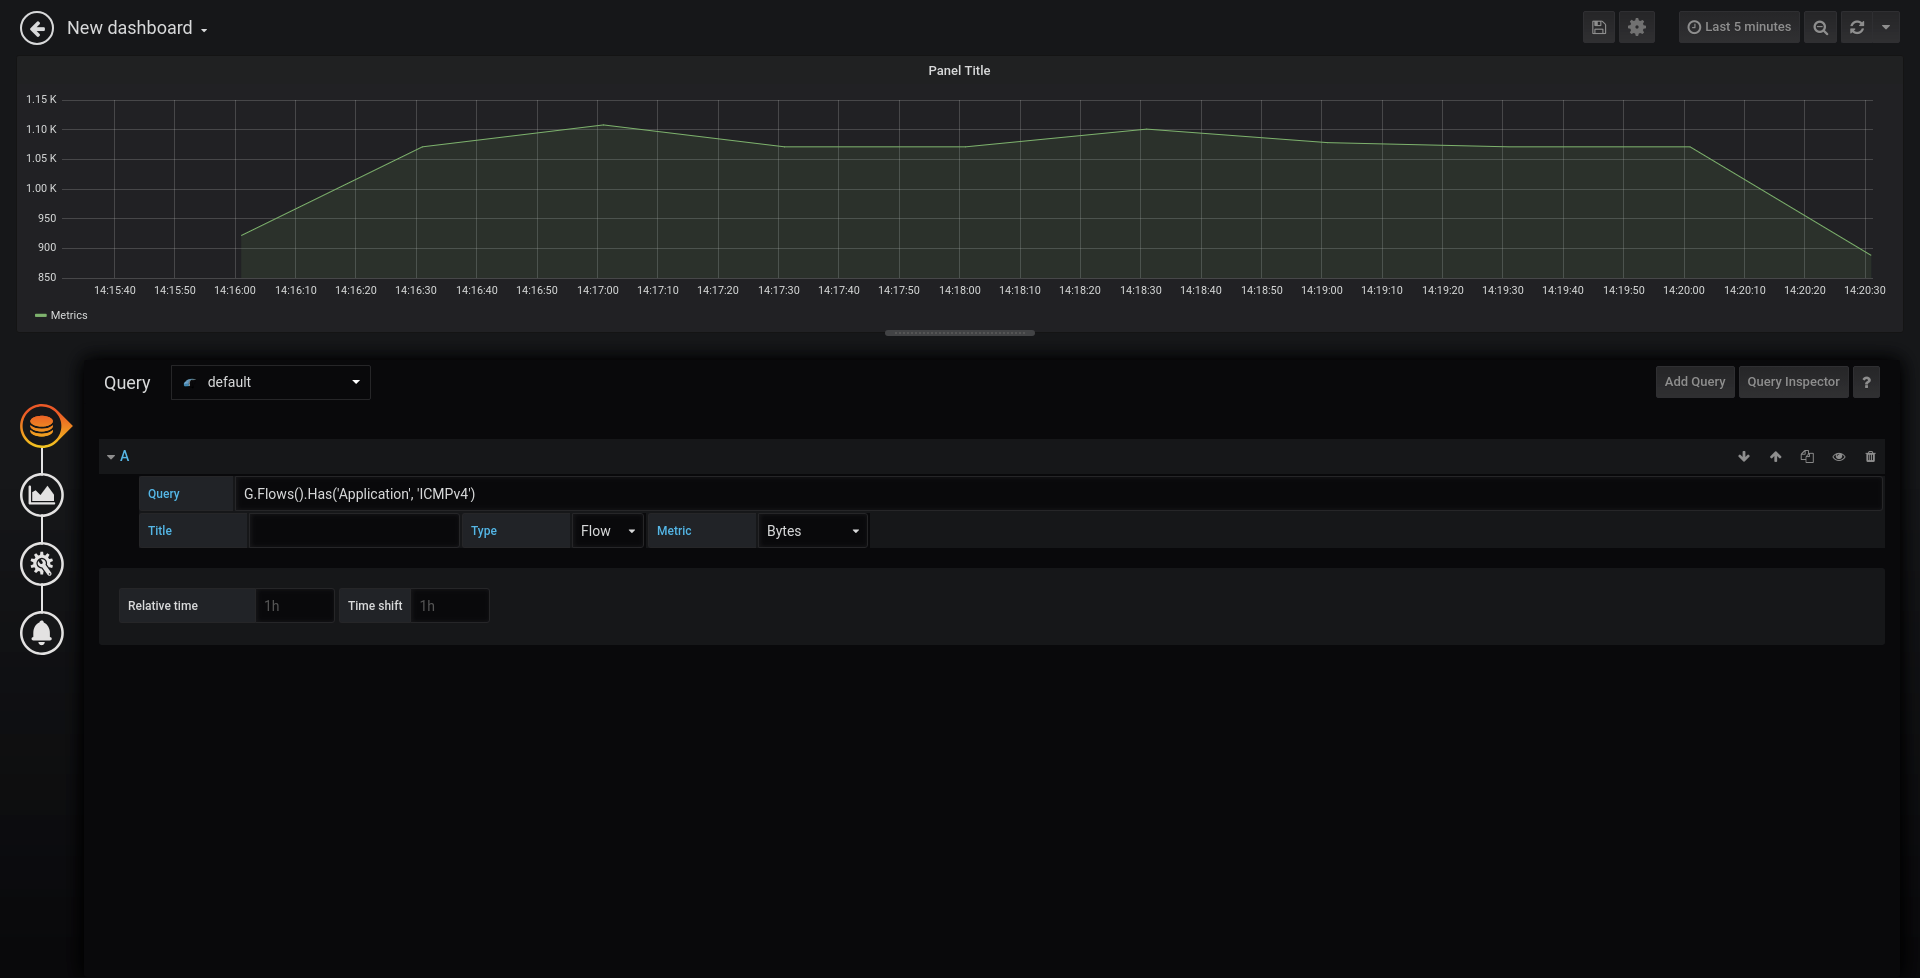
Finally RTT
Skydive compute the RTT using two-way packets, like SYN/SYN-ACK or ICMP ECHO/REPLY.
In order to get the RTT we start a capture on the eth0 interface of one network namespace.
Then it is just matter of selecting the RTT metric in the query editor.

Let’s add a bit of latency….
sudo tc qdisc add dev vm1-eth0 root netem delay 400ms
Which gives…