Skydive-Prometheus Connector
by Kalman Meth, 1/11/2020Prometheus is an open-source systems monitoring and alerting tool. Many different types of data are collected by different tools and are forwarded to Prometheus via various types of exporters. For example, the Prometheus Node Exporter exposes a wide variety of hardware- and kernel-related metrics. We developed an exporter for Skydive that reports metrics of individual captured network flows. The connector translates data from Skydive captured flows into a format that can be consumed by Prometheus. The first implementation of the Skydive-Prometheus connector periodically provides the byte transfer counts for each network connection under observation. The code can be easily tailored to provide additional flow information.
The structure of the interacting components is depicted in the following figure.

Deploy Skydive
You can either download a statically linked version of Skydive or you can build it on your own.
To download a pre-compiled statically linked version of Skydive, run the following command.
curl -Lo skydive https://github.com/skydive-project/skydive-binaries/raw/jenkins-builds/skydive-latest && chmod +x skydive && sudo mv skydive /usr/local/skydive/To build your own version of Skydive, follow the instructions on Build Documentation to install prerequisites and prepare your machine to build the Skydive code. Enter the Skydive root directory and build the code.
cd $GOPATH/src/github.com/skydive-project/skydive
make
cp etc/skydive.yml.default /etc/skydive/skydive.yml
Adjust settings in skydive.yml, if desired.
The skydive binary is created in $GOPATH/bin/skydive.
All-in-one version
sudo skydive allineone -c /etc/skydive/skydive.ymlMulti-node Deployment
Alternatively, run a Skydive analyzer on one host and a Skydive agent on each of your hosts.
On one machine:
sudo skydive analyzer -c /etc/skydive/skydive.ymlOn each machine:
sudo skydive agent -c /etc/skydive/skydive.ymlBe sure to set the field analyzers in the skydive.yml to point to the analyzer.
Create Skydive-Prometheus Connector Configuration File
Start from the prom_sky_con.yml.default in the prom_sky_con directory.
cp prom_sky_con.yml.default /etc/skydive/prom_sky_con.ymlThe prom_sky_con.yml is used as a parameter when running prom_sky_con from the command line.
The default prom_sky_con.yml has the following fields:
host_id: ""
analyzers:
  - 127.0.0.1:8082
analyzer:
  auth:
    cluster:
      username:
      password:
pipeline:
  subscriber:
    url: ws://127.0.0.1:8082/ws/subscriber/flow
    capture_id:
  classify:
    # cluster_net_masks:
      # - 10.0.0.0/8
      # - 172.16.0.0/12
      # - 192.168.0.0/16
  transform:
    type: none
  store:
    type: prom_sky_con
    prom_sky_con:
      port: 9100
      connection_timeout: 60
The paramaters in the yml file are inherited from the generic skydive-flow-exporter.
The main entries that may need adjustment are those involving the address of the Skydive analyzers and subscriber.
The port and connection_timeout parameters under store.prom_sky_con may also be adjusted.
store.prom_sky_con.port is the network port at which Prometheus will probe the connector to pull the metrics.
This port number must match the value specified in the Prometheus config file for the Skydive-Prometheus connector.
store.prom_sky_con.connection_timeout is the number of seconds that have elapsed with no traffic on a connection before we assume the connection is inactive.
Fields specific to Skydive-Prometheus connector
| Field Name | Type | Description |
|---|---|---|
| pipeline.store.type | string | set to prom_sky_con |
| pipeline.store.prom_sky_con.port | int | port number used between Prometheus and connector to scrape the supplied metrics |
| pipeline.store.prom_sky_con.connection_timeout | int | number of seconds with no traffic before considering a connection as dead |
Build and Deploy the Skydive-Prometheus connector
cd $GOPATH/src/github.com/skydive-project/skydive-flow-exporter/prom_sky_con
make static

prom_sky_con /etc/skydive/prom_sky_con.yml
Generate and Capture Flows
Capture Flows
Via the Skydive WebUI setup captures and generate traffic which should result in the prom_sky_con pipeline sending flows to the Prometheus.
To connect to the GUI, open a web browser to the address of the Skydive analyzer at port 8082. If running the browser on the same machine as the analyzer, then connect to localhost:8082.
You should see the topology of your network, perhaps something like the following image.
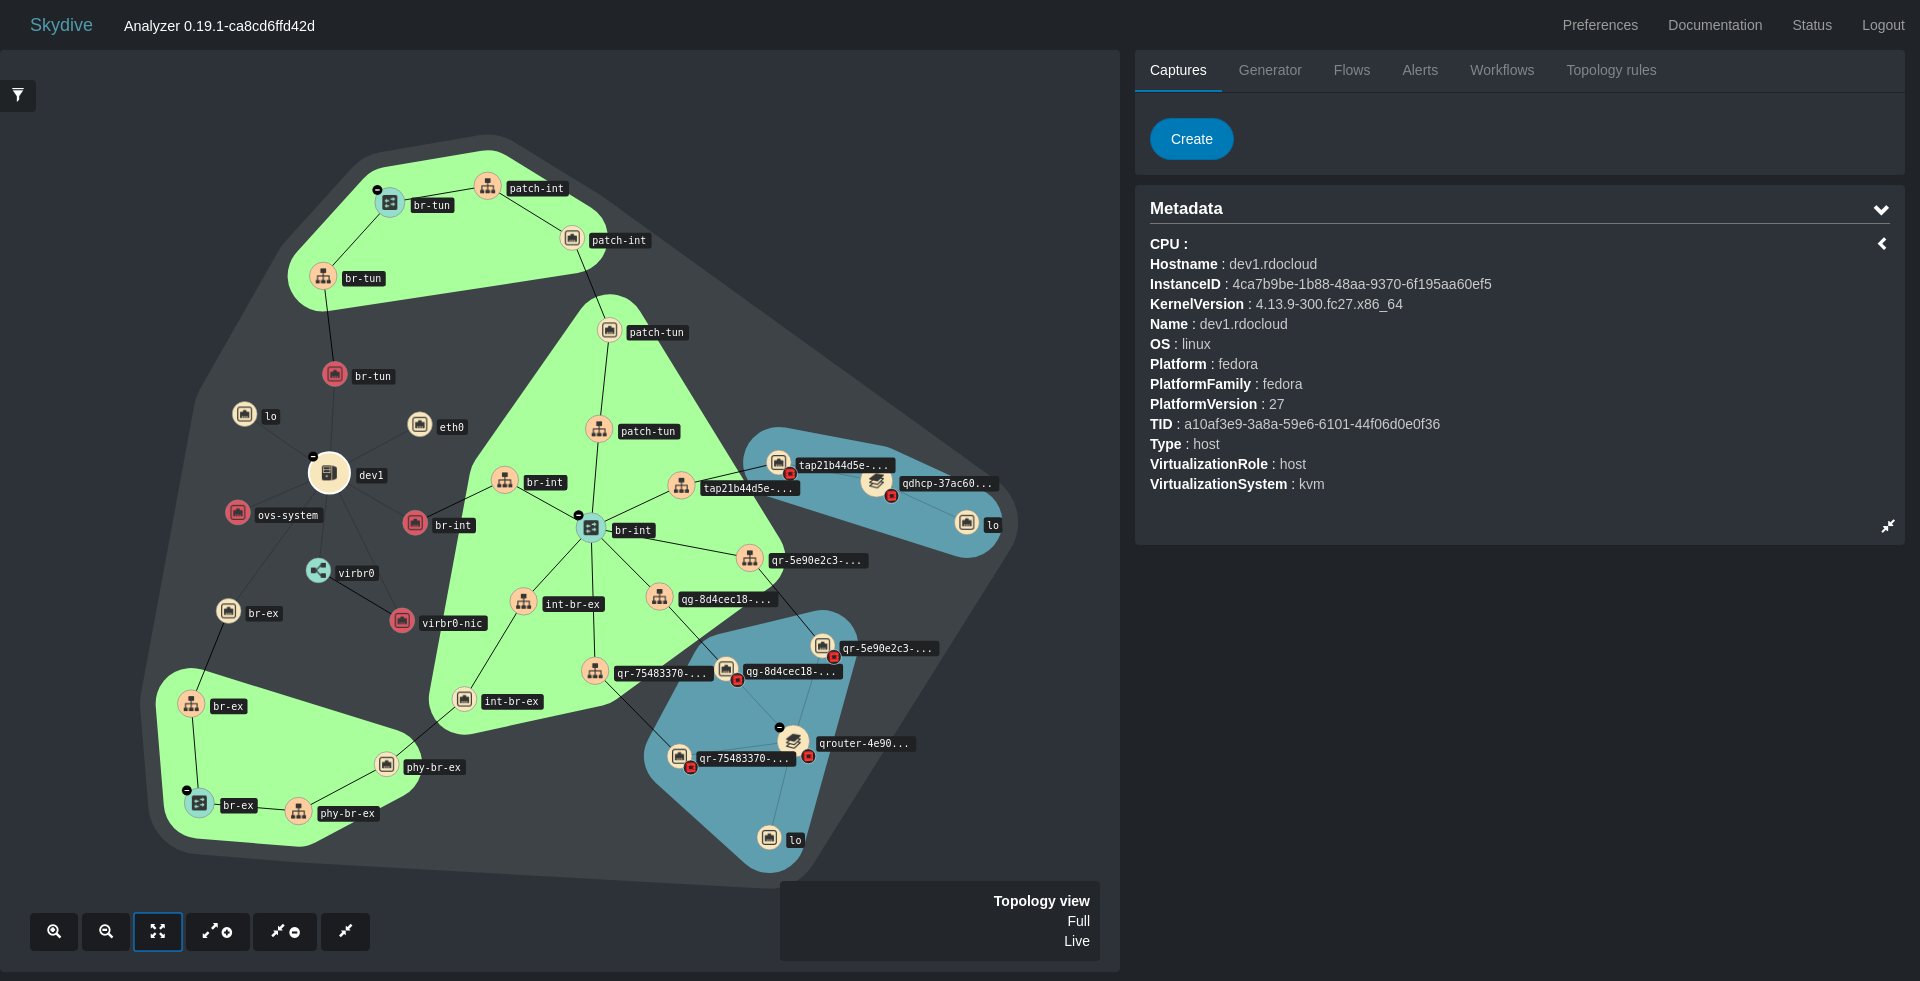
Make sure you are on the Captures view and press on Create.
Fill in the Targets fields by placing the cursor in the first Interface field and then use the mouse to point to your network endpoint that you want to capture.
To capture a particular flow end-to-end, fill in the second Interface field in a similar manner with the other network endpoint.
Then press the Start button on the GUI.
Alternatively, you can start the capture of flows from the command line with a command like the following:
skydive client capture create --gremlin "G.V().Has('Type', 'device', 'Name', 'eth0')" --type pcap The command specifies to capture all flows that match the gremlin expression - in this case, all devices that have name ‘eth0’.
Generate Flows
Generate some network traffic on the interfaces you specified to capture. For example, run some iperf traffic between entities and capture the flow via the Skydive GUI.
To install iperf3 (on ubuntu/debian):
sudo apt install iperf3Run iperf server:
iperf3 -sEither on the same machine or on another machine, run the iperf client:
iperf3 -c <address-of-iperfserever> -t 10000It is also possible to generate network traffic using the inject feature of Skydive, either from the command line or through the Skydive GUI.
Go the Generator page and specify the source and destination nodes between which to generate the network traffic, as well as the characterization of the flow you want to generate.
Prometheus setup
In the Prometheus config file, add a stanza specifying the location and port used by the Skydive-Prometheus connector.
  - job_name: 'skydive-connector'
    static_configs:
    - targets: ['xx.xx.xx.xx:9100']
Restart Prometheus to pick up the new stanza in the config file.
Output of Skydive-Prometheus connector
| Metric Name | Type | Description | Labels |
|---|---|---|---|
| skydive_network_connection_total_bytes | int | total bytes transferred on connection | initiator_ip, target_ip, initiator_port, target_port, direction, node_tid |
Verify Operation
Wait for 60 seconds and then check that we have data arriving in the Prometheus GUI.
Look for a metric beginning with skydive such as skydive_network_connection_total_bytes.
You can display a graph of all the flows that have been captured that report the skydive_network_connection_total_bytes metrics.
To see a graph of the bandwidth (bytes per second instead of total bytes transferred) used by flows, you can graph on the variable rate(skydive_network_connection_total_bytes[1m]).
The data shown in the graph should contain the following fields:
initiator_iptarget_ipinitiator_porttarget_portdirectionnode_tid
Each such tuple is associated with timestamps and corresponding values that appear in the graph.
The graph in the Prometheus GUI may look something like the following:
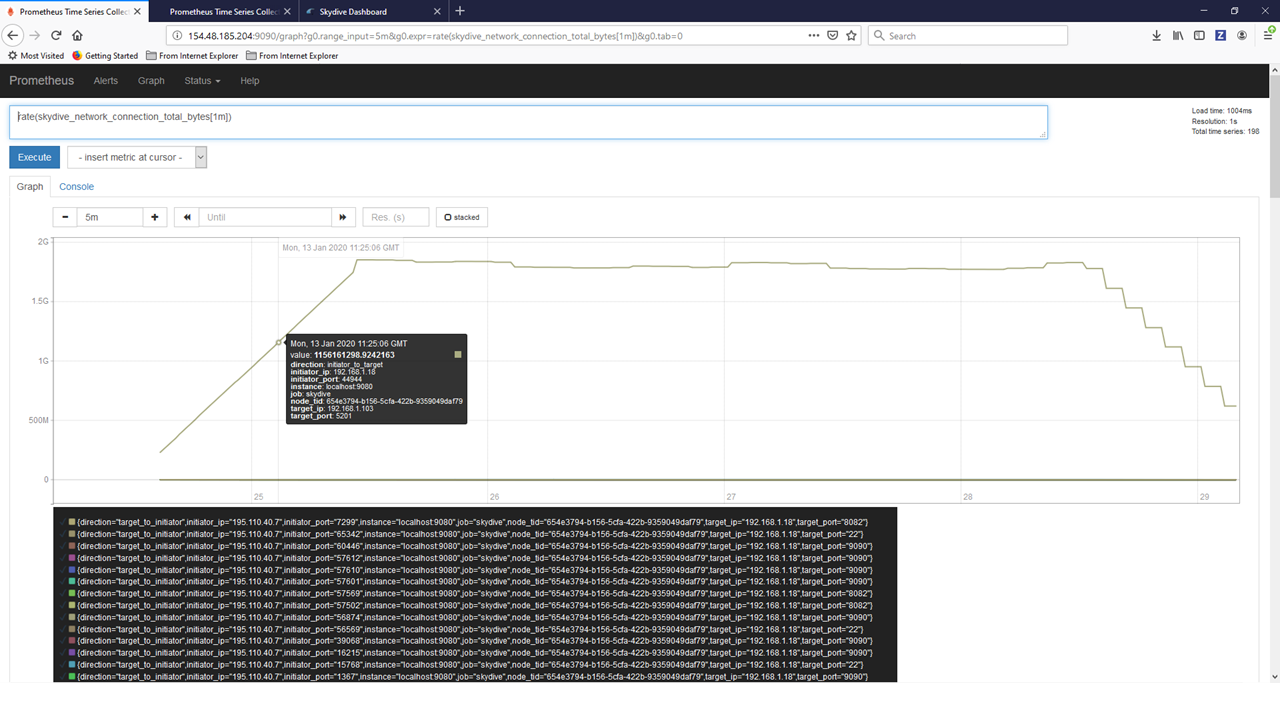
The graph shows the data rate of various connections that are tracked by Skydive.