Collectd as Skydive metrics provider
by Sylvain Afchain, 08/08/2019We recently introduced a first version of a Skydive Collectd plugin.
This aims to leverage some Collectd plugins to enhance the
Skydive topology. This blog post will explain how the Skydive architecture allowed to implement it quickly and how the metrics
are reported.
Topology as a Graph
As you may know, behind the scene the Skydive topology is a Graph. More than that Skydive is a Publisher/Subscriber Graph. It means that we can subscribe
to get notifications when something changed and that we can publish information. We used this capability and the library provided by Skydive
to write our Collectd plugin. This plugin is a publisher. It is written in Go and comes as a shared library once compiled.
This documentation explains how to build it and configure it.
The following schema shows the global architecture of a common deployment and the components involved.
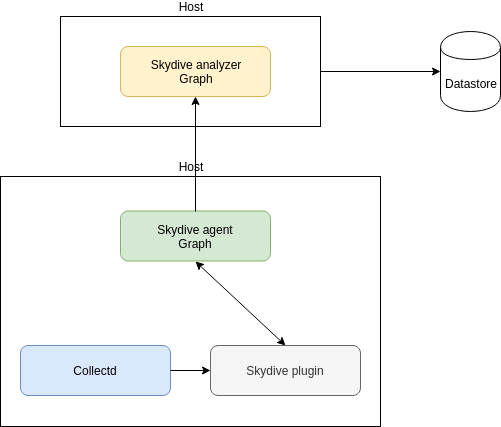
Fairly simple : Collectd collects the information, calls the writer function of the Skydive plugin
which subscribed to the Agent graph. Then the Agent will forward the information to the Analyzer.
Finally the information will be archived if a datastore is set up.
Data in Skydive
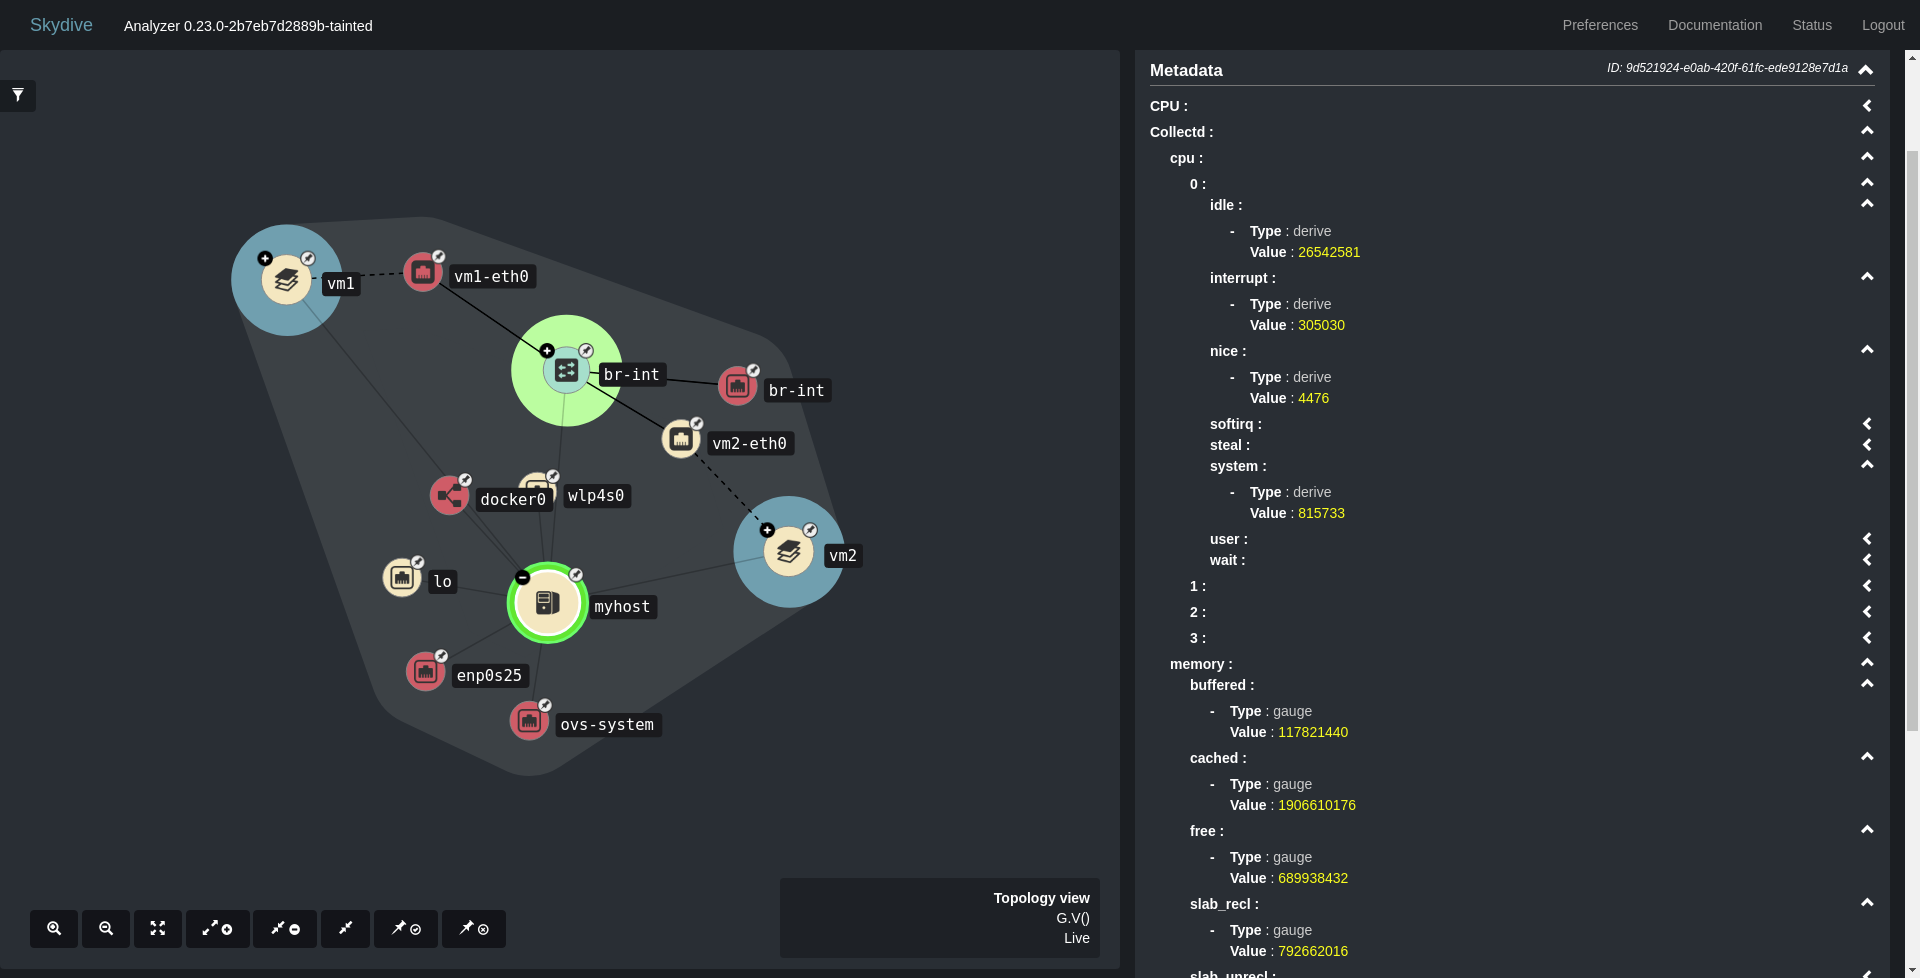
The Skydive plugin exports the Collectd data as part of the Host node schema under the sub-key Collectd.
Here what you will get in the WebUI with the Collectd CPU and Memory plugins.
As it is now part of the Skydive graph we can use the Gremlin
query language to retrieve the information.
skydive client query 'G.V().HasKey("Collectd").Values("Collectd.cpu.0.user")'
[
	[
		{
			"Type": "derive",
			"Value": 2745007
		}
	]
]
History & Conclusion
Having Collectd metrics in the topology means that, with a datastore set up, we can get metrics history from Skydive.